
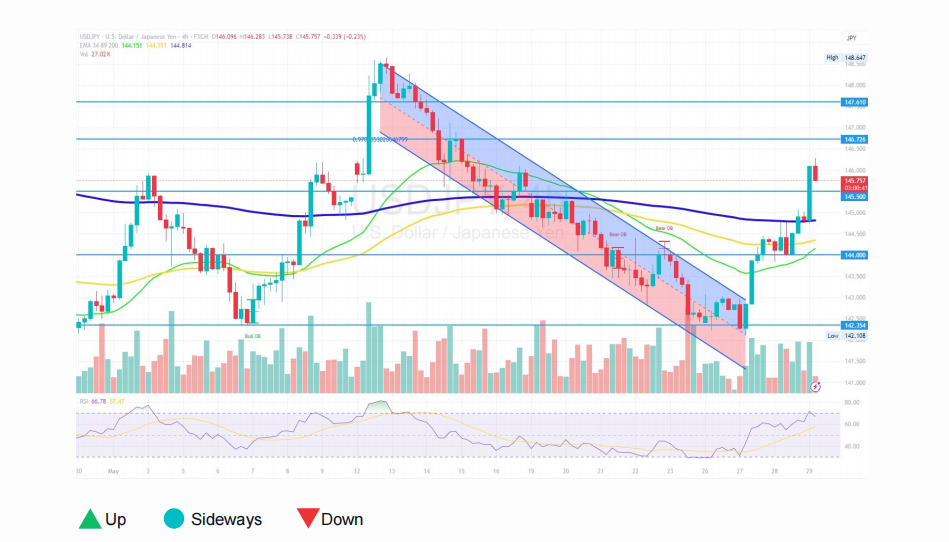
USD/JPY Surges to 145.86 After U.S. Tariff Ruling

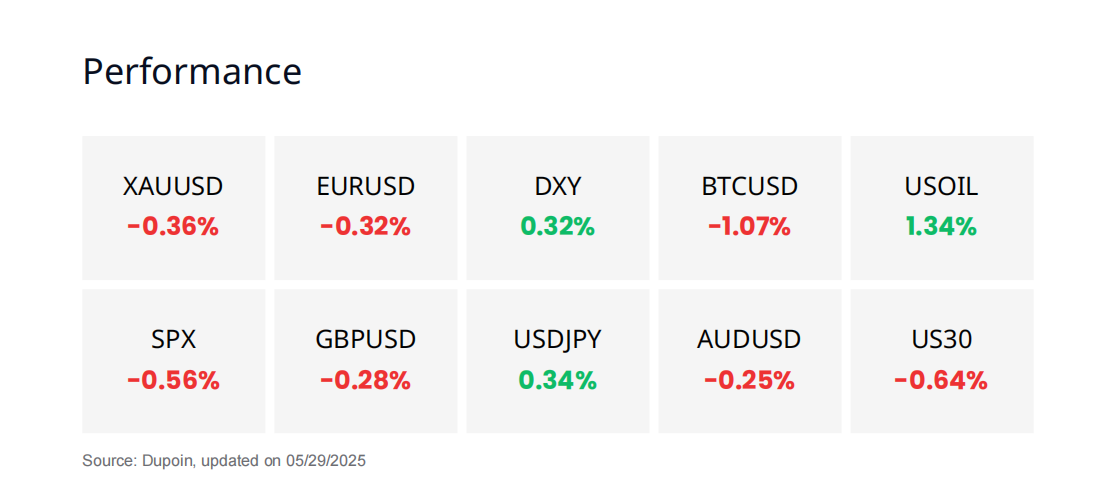
Market Overview
China
The offshore yuan fell below the 7.20 per USD mark, marking its third consecutive decline, as the U.S. dollar strengthened following a U.S. court ruling that overturned the "Liberation Day" import tariffs imposed by Trump. At the same time, the U.S. has tightened export controls on technology to China.
In response, Beijing condemned the U.S. for abusing the concept of national security and obstructing trade. These developments come amid a temporary trade truce between China and the U.S., despite prior agreements to ease tariffs.
Cryptocurrency
Bitcoin has pulled back to the $106,800 support zone after failing to hold the $108,500 level, and is now consolidating below $108,000 with a potential breakout setup. If it breaks above $109,000, BTC may target the $110,000–$112,000 range again; otherwise, losing support could drive the price down to $105,000 or lower.
Meanwhile, expectations for a strong Altseason are rising as FTX prepares to distribute over $5 billion in stablecoins to creditors on May 30. This liquidity injection—nearly 2% of the total stablecoin supply—could provide a major boost to the altcoin market, especially Ethereum.
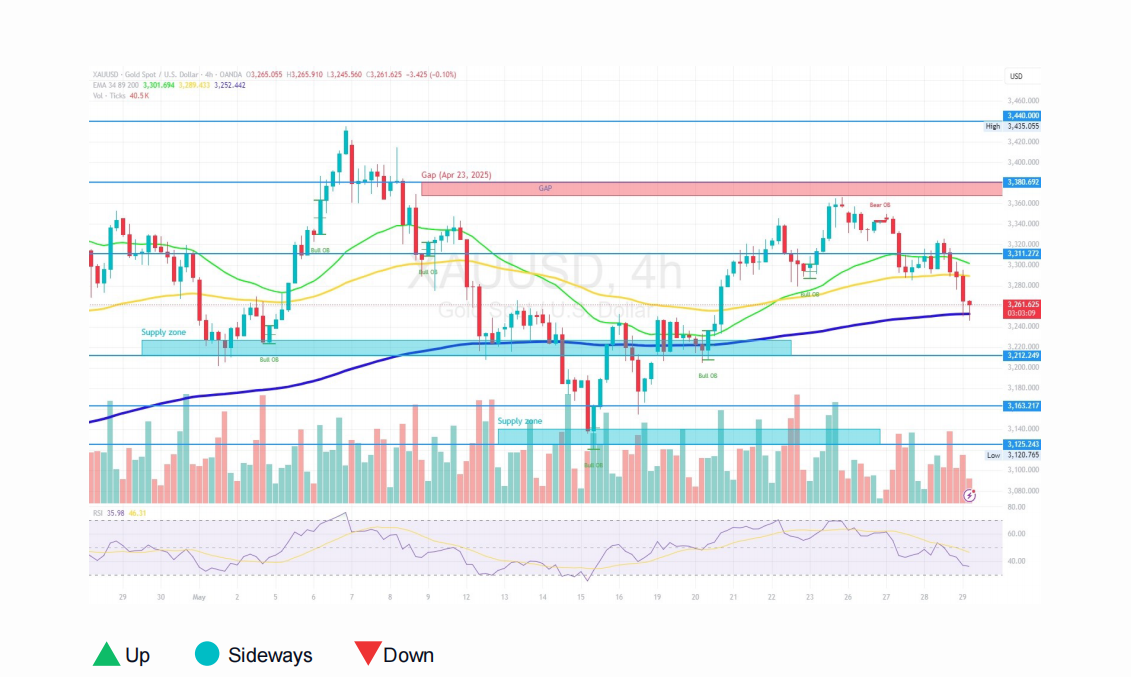
Gold Spot (XAUUSD)

Fundamental Analysis
Gold prices fell nearly 1% to around $3,260/oz, marking the third consecutive decline, as trade tensions eased following a U.S. federal court ruling that declared President Trump overstepped his authority in imposing retaliatory tariffs. The decision dampened safe-haven demand and dealt a blow to Trump’s economic agenda.
The Federal Reserve’s May meeting minutes revealed that policymakers are closely monitoring economic developments and are concerned about rising risks of both inflation and unemployment. Meanwhile, U.S. gold exports to Switzerland surged after the removal of precious metals tariffs.
Technical Analysis
Price has just broken below the EMA 89 and is now testing the EMA 200 near the $3,260 area. The market structure shows signs of a bearish reversal after failing to hold the high at the Bearish Order Block (Bear OB) around $3,355.
RSI is currently at approximately 35.98, nearing oversold territory. This indicates strong selling pressure but also suggests the potential for a technical rebound if RSI drops below 30, approaching psychological support. Trading volume has slightly increased on the most recent red candle, confirming that the downward move is backed by genuine selling pressure.
Dollar - yen (USDJPY)

Fundamental Analysis
The USD/JPY exchange rate surged to 145.86 (+0.72%) after the U.S. Court of International Trade ruled that the global tariffs imposed by former President Trump were unlawful. This decision eased fears of a trade war, boosting risk sentiment and prompting capital outflows from safe-haven assets.
However, experts warn that the White House may appeal the decision to the Supreme Court, which could keep forex markets volatile. At the same time, the weakening yen supported Japanese equities—led by chipmakers and automakers—helping the Nikkei index rise by 1.1%.v
Technical Analysis
After a sharp decline within a descending channel, USD/JPY has broken out of the channel with a strong surge above the EMA zone.The breakout candle came with high volume, confirming strong buying momentum has returned.
The RSI is currently at 66.78, approaching overbought territory, but there are no signs of divergence or weakening yet, indicating the uptrend may still have room to continue in the short term.
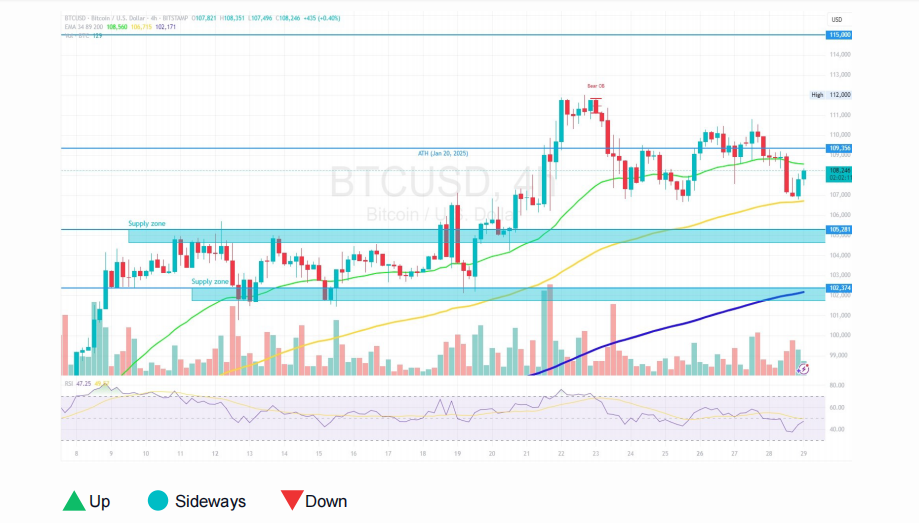
Bitcoin (BTCUSD)

Fundamental Analysis
Bitcoin is holding around $109,000 after several days of ranging between $106,200 and $111,800. Despite increasing profit-taking pressure from miners, on-chain data shows that “diamond hands” are actively accumulating—long-term holders have added 300,000 BTC in just 20 days.
The Long-Term Holder (LTH) spending indicator has dropped to its lowest level since September 2024—a signal that previously preceded a 96% rally. Experts believe that if the pattern repeats, BTC could advance toward the $200,000 zone. Confidence from long-term investors is reinforcing a strong accumulation trend.
Technical Analysis
BTC is currently in a correction phase after failing to hold the resistance zone around $109,000–$112,000.The short-term price structure shows lower highs, indicating weakening momentum, and the price is now retesting dynamic support areas.
Trading volume has slightly increased during recent down sessions, suggesting that selling pressure is dominating in the short term. RSI is at 47.25 — neutral but slightly weak, reflecting a lack of bullish momentum at this stage.
Disclaimer
Derivative investments involve significant risks that may result in the loss of your invested capital. You are advised to carefully read and study the legality of the company, products, and trading rules before deciding to invest your money. Be responsible and accountable in your trading.
RISK WARNING IN TRADING
Transactions via margin involve leverage mechanisms, have high risks, and may not be suitable for all investors. THERE IS NO GUARANTEE OF PROFIT on your investment, so be cautious of those who promise profits in trading. It's recommended not to use funds if you're not ready to incur losses. Before deciding to trade, make sure you understand the risks involved and also consider your experience.
