
Bitcoin Holding Strong – Short-Term Correction or Buy-the-Dip?

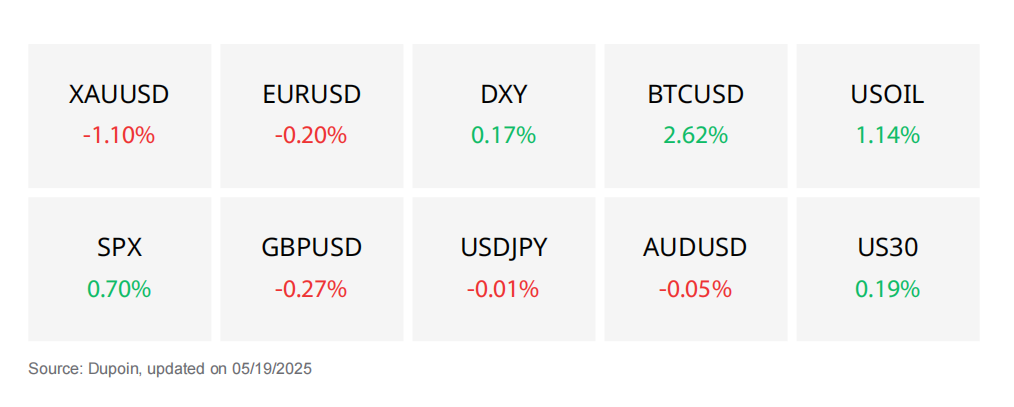
Market Overview
China
In May 2025, the CNY/USD exchange rate remained stable around 7.21, near its two-month low, amid mixed economic data from China. April retail sales growth slowed and missed expectations, while industrial output exceeded forecasts but slowed compared to the previous month. Trade talks with the US remained unclear, keeping the market cautious. The yuan found support from a weaker USD, following a US credit rating downgrade and expectations of potential Federal Reserve rate cuts.
Investors are focused on the People's Bank of China's (PBOC) upcoming decisions on key lending rates. China's economic growth forecast for 2025 remains at 4-5%, with a global recovery outlook, particularly for China.
Cryptocurrency
The crypto market has just recorded its sixth consecutive weekly gain, led by Bitcoin closing at an all-time high near $106,500. BTC is now less than 3% away from its peak at $109,356, fueling expectations of a potential breakout. Capital inflows from the U.S. are increasing, as the Coinbase premium returns, along with anticipation that institutional funds will continue accumulating.
Meanwhile, altcoins like ETH, XMR, and AAVE are also gaining momentum, signaling a possible upcoming “altcoin season.” On-chain data indicates heightened volatility may occur in the coming weeks.
XAU/USD
Prediction: Decrease
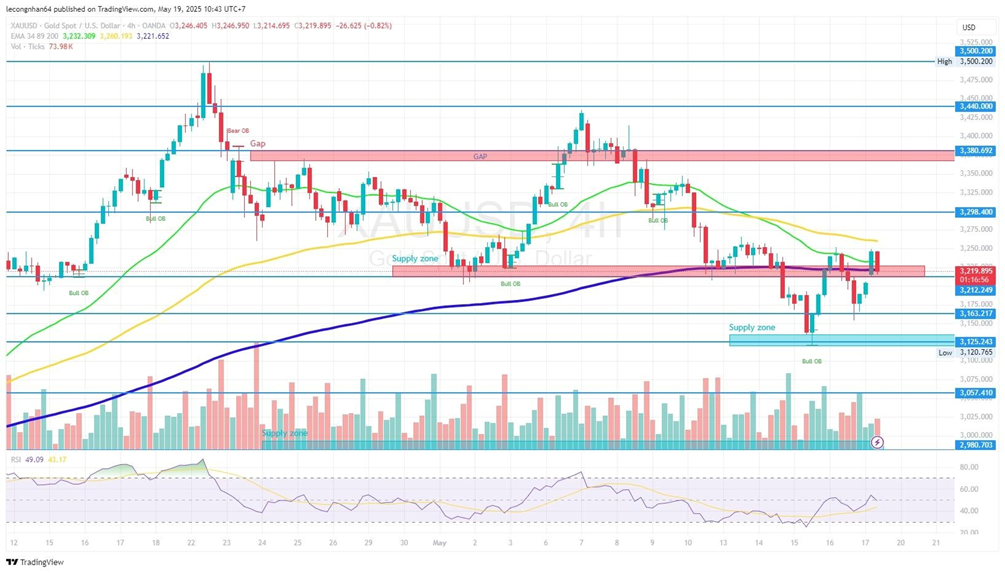
Gold is currently trading around $3,219.8, showing a slight increase in the early part of the week after dropping more than 3% last week – the steepest drop in 6 months. Although gold has recovered from the demand zone between $3,120 – $3,150, the short-term structure still leans towards a bearish trend with lower highs and lower lows. However, support levels below are holding up well, maintaining the long-term bullish structure.
FUNDAMENTAL ANALYSIS
Monetary Policy and Fed Impact
Recent data (CPI, PPI) shows that U.S. inflation is cooling, along with some weaker-than-expected economic indicators, leading markets to expect the Fed to cut rates 1-2 times by the end of 2025. This would reduce U.S. Treasury yields and the U.S. dollar, supporting a bounce in gold.
However, downside risks remain if the Fed continues a more cautious stance than expected.
Inflation and Market Drivers
Moody’s recently downgraded the U.S. credit rating, raising concerns about the budget deficit and rising borrowing costs. This has increased demand for gold as a non-yielding safe haven.
In addition, the temporary U.S.-China tax pause for 90 days has eased concerns about a global recession, but it has somewhat reduced the upward momentum for gold.
Geopolitics and Market Sentiment
Safe-haven demand has increased following Moody’s downgrade of U.S. debt.
Central banks, including China, continue to buy gold.
Although Bitcoin has surged, outperforming gold in 2025, gold’s stability and traditional role remain crucial for long-term portfolios.
- $3,250 – $3,260: Supply zone + EMA 89 → Strong short-term resistance.
- $3,298: Strong technical resistance, the most recent peak before the drop.
- $3,380 – $3,400: Gap zone, a psychological resistance for the medium term.
Key Support Levels
- $3,212 – $3,215: Short-term support zone.
- $3,175: Mid-range support level.
- $3,120 – $3,150: Primary demand zone – where the price bounced strongly.
- $3,057 – $3,075: Stronger support if the demand zone is broken.
Technical Indicators:
RSI: Currently at 49.09, close to neutral. Previously, RSI bounced from near oversold levels but has not clearly exceeded 50 → weak upward momentum, likely sideways movement.
EMA: Price is below EMA 34 and EMA 89, indicating weak short-term trend. EMA 34 is showing signs of crossing below EMA 89, confirming a short-term downtrend. However, price is still holding above EMA 200, indicating the long-term bullish structure is intact.
Volume: Maintains a reasonably average level during the recovery → there is buying interest but not explosive yet. If the price is rejected at $3,250, it may revisit lower support levels.
EUR/USD
Prediction: Sideways
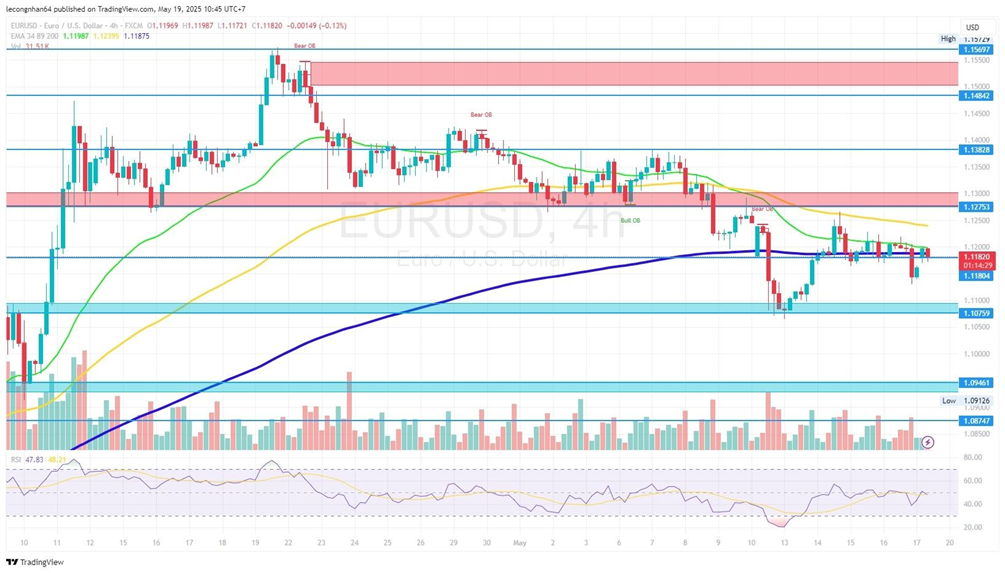
EUR/USD is maintaining a short-term bearish trend after being rejected at the resistance level of 1.1275. The price structure has not clearly established a new low, but it is still trading below important EMA levels. The support zone around 1.1180 remains intact, creating a consolidation phase.
FUNDAMENTAL ANALYSIS
Monetary Policy and Fed Impact:
The market still expects the Fed to cut rates in 2025, but the expected rate cut has been reduced to 53 basis points (down from over 100 points previously).
U.S. 10-year Treasury yields have risen to 4.49%, putting light pressure on EUR/USD.
However, Moody’s unexpected downgrade of the U.S. credit rating has reduced confidence in U.S. fiscal policy, leading to a weaker USD at the start of the week.
Economic Situation & Macro Data:
Trump’s new tax-cut plan has been approved by the U.S. House of Representatives but is expected to increase the national debt by $3-5 trillion. This has raised concerns in the market, reducing the attractiveness of the USD.
China’s industrial production data exceeded expectations (6.1%), but retail sales and fixed asset investment were weaker, suggesting the recovery is not yet sustainable.
U.S. and Asian stock markets both dropped in early trading, reflecting cautious sentiment toward global economic policy.
Geopolitics & Market Sentiment:
The victory of the EU-friendly centrist candidate in Romania has reinforced confidence in the political stability within the EU, supporting the EUR.
ECB President Lagarde stated that the loss of confidence in U.S. policy is a reasonable factor driving EUR/USD higher.
- ECB members (Schnabel, Kazaks) have signaled caution regarding rate cuts, showing that the ECB remains neutral-to-slightly hawkish.
- 1.1275: Medium-term resistance, where price was previously strongly rejected.
- 1.1382: Next resistance zone if price breaks above 1.1275.
Key Support Levels
- 1.1180 – 1.1185: Near-term support zone, currently being tested.
- 1.1075: Strong support, where price previously bounced strongly.
- 1.0946 – 1.0874: Long-term support, overlapping with the Bull OB zone.
Technical Indicators:
RSI: Currently at 47.83, hovering around neutral, indicating an unclear trend. There are no clear divergence signals, but since RSI is above 40, a new low has not been confirmed.
Volume: Low and dispersed volume, suggesting the market is waiting for signals from upcoming economic events (Williams' speech, PMI data).
BTC/USD
Prediction: Bullish
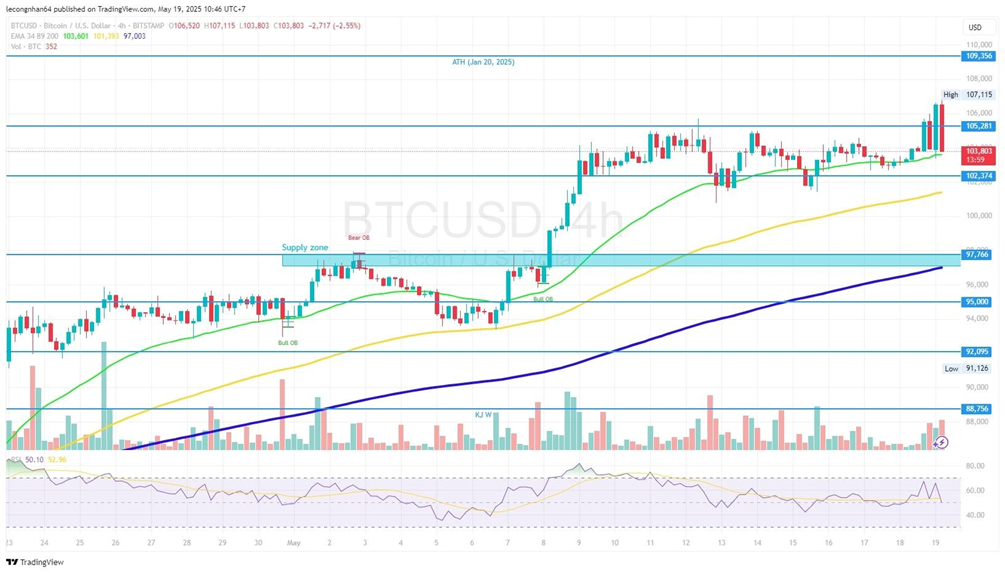
Bitcoin continues its strong bullish trend, with 6 consecutive weeks of gains and recording its highest-ever weekly close near $106,500. However, after reaching an intraday high of $107,115, the price has slightly corrected to around $103,800. The bullish structure remains intact, but short-term profit-taking signals have emerged.
FUNDAMENTAL ANALYSIS
Monetary Policy & Fed Impact
There are no new policies from the Fed yet, but the market still expects two rate cuts in 2025. The temporary weakness of the USD has provided favorable conditions for money to flow into risk assets like Bitcoin.
Inflation & Market Drivers
Inflation is back in focus as the market awaits the release of CPI and PPI data this week. Bitcoin is being considered as "the newest macro asset in 150 years," with a long-term CAGR estimated at 8% (according to Willy Woo), leading funds to continue accumulating.
Geopolitics & Market Sentiment
The instability in Australia regarding the seizure of $2.88 million in BTC and other assets from a hack highlights Bitcoin's role as an asset of interest from both legal and speculative perspectives. Positive sentiment continues to dominate.
ETF Market & Altcoins
The Coinbase premium has returned, indicating strong inflows from U.S. investors. Some experts predict that BTC could reach $200,000 by the end of 2025 due to supply shock. Additionally, the altcoin season is expected to start soon, providing support for the overall crypto market.
On-Chain Volatility & OI Data
The 180-day Open Interest Delta index is approaching negative territory – this could be a sign of significant volatility ahead. If the data continues to worsen, it could signal a prolonged accumulation or correction phase.
- $105,500: The nearest resistance, applying short-term pressure.
- $107,115: The most recent intraday high.
- $109,356: The ATH (January 20, 2025). A break above this level would open the path to $110,922 or $116,000.
Key Support Levels
- $104,200: Short-term upward trendline on H1.
- $103,500: Strong support with the EMA 34 on H4.
- $101,393 – $97,766: EMA 89 & the previous “supply zone,” now turned into strong support.
Technical Indicators:
EMA: Price remains above EMA 200 ($97,003), indicating a medium-term bullish trend. However, if the price adjusts closer to EMA 34 ($102,374), it should be monitored closely for a potential break.
RSI: The RSI on H4 is currently ~52.96, recently withdrawing from the overbought zone, reflecting a technical correction after the strong upward move. No major reversal signals yet.
Volume: There has been a significant spike in volume during the most recent corrective candles, indicating that short-term selling pressure is testing the market’s resilience. If this continues, a deeper decline may occur before a recovery.
Disclaimer
Derivative investments involve significant risks that may result in the loss of your invested capital. You are advised to carefully read and study the legality of the company, products, and trading rules before deciding to invest your money. Be responsible and accountable in your trading.
RISK WARNING IN TRADING
Transactions via margin involve leverage mechanisms, have high risks, and may not be suitable for all investors. THERE IS NO GUARANTEE OF PROFIT on your investment, so be cautious of those who promise profits in trading. It's recommended not to use funds if you're not ready to incur losses. Before deciding to trade, make sure you understand the risks involved and also consider your experience.
