
EUR/USD Eyes Recovery as Weak US Data Fuels Dollar Decline

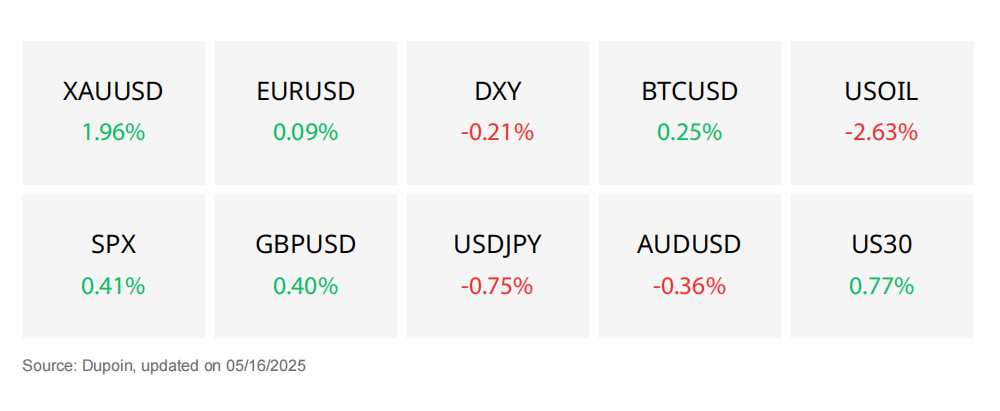
U.S market
The U.S. market is showing signs of cooling inflation, with the April Producer Price Index (PPI) rising 2.4% year-over-year, down from 3.4% in March. This data strengthens expectations that the Federal Reserve (Fed) may begin cutting interest rates in the second half of 2025. The 10-year U.S. Treasury yield has fallen to 4.457%, supporting risk assets and non-yielding assets like gold.
However, April retail sales rose only 0.1%, below the expected 0.15%, indicating a slowdown in consumer spending. The U.S. dollar weakened slightly, helping the stock market remain stable despite emerging correction pressures.
Cryptocurrency
On May 16, the crypto market saw Bitcoin continue to consolidate in the $103,000–$105,000 range, maintaining its upward trend as technical indicators like MACD and RSI support the recovery momentum. On-chain data shows that long-term investors have yet to take profits, indicating strong confidence in the potential for a new all-time high in the near future.
On the fundamental side, confidence in Bitcoin was further reinforced by the move of Méliuz — a Brazilian fintech company — which became the first publicly listed firm in the country to hold BTC as a strategic asset. Bitcoin is projected to target the $108,000–$110,000 range.
XAU/USD
Prediction: Decrease
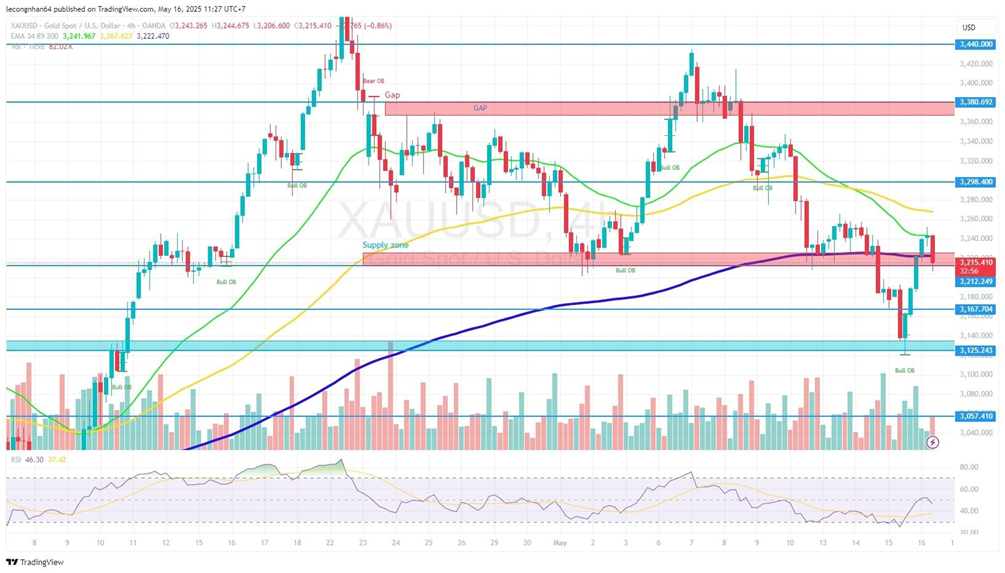
Gold is undergoing a slight correction after reaching the resistance zone at $3,215–$3,222. Overall, the long-term trend structure remains bullish with higher lows, but currently, the price is being rejected at the EMA 200 (H4), with increased selling volume. The current price around $3,215 suggests that the market is consolidating after a nearly 3% decline this week.
FUNDAMENTAL ANALYSIS
Monetary Policy and Fed Impact:
The Fed is expected to cut interest rates at least twice in 2025 due to recent CPI and PPI data signaling initial disinflation. However, Chairman Jerome Powell has warned that inflation could be volatile in the future due to supply chain shocks, which pose risks to monetary policy.
The 10-year US Treasury yield has dropped sharply to 4.457%, which supports gold by reducing the opportunity cost of holding non-yielding assets like gold.
Inflation and Market Drivers:
PPI for April increased by 2.4% year-over-year, down from 3.4% in March.
Retail Sales for April rose by only 0.1%, below the expected 0.15%.
These weak data reduce growth expectations and support gold as a hedge asset.
Geopolitical and Market Sentiment:
US-China tensions have eased with a 90-day tariff pause agreement, reducing demand for safe-haven assets.
India-Pakistan have upheld the ceasefire agreement.
Russia-Ukraine negotiations have stalled, maintaining geopolitical risk.
Gold continues to show resilience amid macroeconomic instability.
TECHNICAL ANALYSIS
Key Resistance Levels
- $3,215 – $3,222: This is a significant resistance zone, coinciding with the previous gap and EMA 200, where the price has recently been rejected.
- $3,298: The recent peak – a potential target if the price breaks the current resistance.
- $3,380 – $3,440: Strong supply zone where the price has faced significant selling previously.
Key Support Levels
- $3,167 – $3,170: The nearest support zone.
- $3,125: Medium-term support, where the price bounced from earlier.
- $3,057: Strong support, the most recent low and where high volume appeared.
Technical Indicators:
RSI: Currently at 46.30, in the neutral zone – no clear overbought/oversold signal. RSI previously touched the 30 (oversold) level and bounced up, indicating a slight recovery.
EMA: The price is below EMA 34, 89, and 200 on the H4 chart, confirming that the bearish trend is dominant.
Trading Volume: Volume spiked during the rebound from $3,125 to $3,215, showing strong buying absorption. However, the recent red candle with high volume indicates strong selling pressure at the $3,215 resistance zone.
EUR/USD
Prediction: Recovery
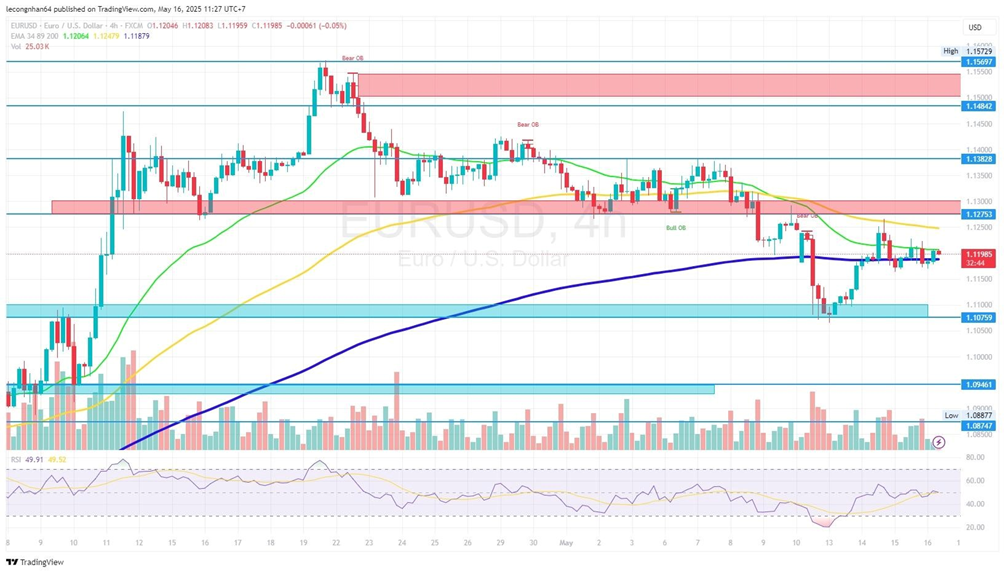
EUR/USD is in a short-term uptrend after breaking through the technical resistance at 1.1175 and maintaining support above the 1.1140 level. The main momentum comes from the weakening of the USD, driven by weak US economic data and expectations that the Federal Reserve (Fed) will cut interest rates further this year.
FUNDAMENTAL ANALYSIS
Weak US Economic Data:
Both the Producer Price Index (PPI) and core retail sales for April were below expectations, signaling easing inflation pressures.
This has increased market expectations for rate cuts from the Fed, which are now priced in at around 56 basis points for 2025 (up from 49 basis points previously).
The 10-year US Treasury yield has dropped sharply to 4.424%, contributing to the weakening of the USD.
Euro Support:
While there is no major economic data from the Eurozone, the EUR benefits from the USD's decline.
Additionally, a more positive outlook on global trade (following the temporary US-China agreement) is supporting market sentiment and risk assets, including the EUR.
Market Sentiment:
The market is in a cautious state heading into the weekend, amidst geopolitical risks (such as the US-Iran nuclear negotiations) and trade policy uncertainty from the Trump administration.
However, with no significant events on the short-term agenda, the EUR/USD recovery trend is likely to continue.
TECHNICAL ANALYSIS
Key Resistance Levels
- 1.12753: Bearish Order Block (OB) – where the price has been repeatedly rejected.
- 1.13828: Strong resistance zone, which previously served as solid support.
- 1.14842 – 1.15697: An extended resistance zone, indicating strong supply in the past.
Key Support Levels
- 1.10759: Strong support zone, with a strong price reaction on the most recent test.
- 1.09461: Potential support if the 1.10759 level is broken.
- 1.08447 – 1.08877: Previous bottom zones, which could provide long-term support.
Technical Indicators:
RSI is fluctuating around 49.91, indicating a neutral market with no clear trend. Previously, RSI touched oversold territory (below 30) and bounced up, signaling a temporary recovery.
Trading Volume: Volume has not spiked, reflecting market hesitation at current price levels. A breakout candle with high volume could signal a strong move.
EMA: The price is below both the EMA 34 and EMA 89, suggesting a prevailing short- and medium-term downtrend. Currently, the price is fluctuating around EMA 200 – if it breaks below this line, the bearish trend is likely to be reinforced.
BTC/USD
Prediction: Increase
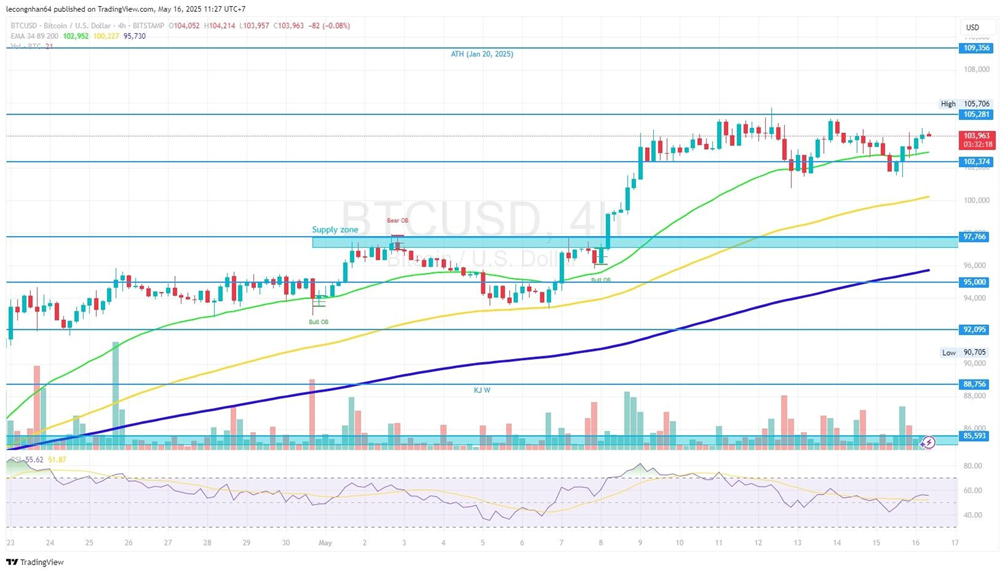
Bitcoin (BTC/USD) is currently maintaining a long-term uptrend, trading around the $102,600 – $104,000 range after bouncing from strong support at $101,500. Although it has not yet broken the significant resistance at $105,000, BTC still shows stable buying pressure, particularly from long-term investors and institutions.
FUNDAMENTAL ANALYSIS
Confidence from Long-Term Holders (LTH):
According to on-chain data from CryptoQuant, the LTH-SOPR index is declining, indicating that long-term holders have not yet realized profits and continue to accumulate, demonstrating confidence that BTC will reach new highs in the near future.
Activity from Whales and Institutions:
Whale wallets are selling less compared to previous bull cycles. The alignment between LTH and whale behavior strengthens the positive mid- and long-term market sentiment.
News Supporting Price:
The fintech company Méliuz (Brazil) has officially become the first listed company in Brazil to adopt a strategy of holding BTC as a treasury asset, with an additional purchase of nearly 275 BTC, bringing their total holdings to over 320 BTC.
Comparison to Gold:
Experts predict that BTC could follow the upward trajectory of gold in the past two years. The potential price forecast for BTC could reach $155,000 in 2025.
Insight from Bitwise CIO:
Matt Hougan, Chief Investment Officer of Bitwise, believes that BTC is on its way to reaching the $200,000 mark, emphasizing the shift of institutional capital toward digital assets.
TECHNICAL ANALYSIS
Key Resistance Levels
- $105,706: This is the most recent peak. If the price surpasses this level, BTC could aim for the ATH around $109,356 (which occurred on January 20, 2025).
- $109,356: The highest historical peak.
Key Support Levels
- $102,374: The nearest support, with the price currently holding steady at this level.
- $97,766: A strong support zone, which was previously resistance but turned into support after being broken.
- $95,000: A dynamic support level, coinciding with the EMA 200.
- $92,095: A deeper support level if the market experiences a sharp decline.
Technical Indicators:
EMA: The price is moving just above the EMA 34, indicating a stable short-term trend. However, it needs to break the $105,706 resistance level to confirm a new upward momentum.
RSI: Currently at 55.62, indicating that the market is neither overbought nor oversold. RSI is showing a slight upward trend after testing the 50 level, supporting the ongoing recovery.
Trading Volume: Trading volume has seen a slight increase in recent sessions but is not yet clear. A breakout with high volume could confirm a strong upward signal.
Disclaimer
Derivative investments involve significant risks that may result in the loss of your invested capital. You are advised to carefully read and study the legality of the company, products, and trading rules before deciding to invest your money. Be responsible and accountable in your trading.
RISK WARNING IN TRADING
Transactions via margin involve leverage mechanisms, have high risks, and may not be suitable for all investors. THERE IS NO GUARANTEE OF PROFIT on your investment, so be cautious of those who promise profits in trading. It's recommended not to use funds if you're not ready to incur losses. Before deciding to trade, make sure you understand the risks involved and also consider your experience.
