
BTC/USD Technical Outlook: Strong Resistance at $88,756 Could Define Next Move


Market Overview
United States
Gold reached a record high of approximately $3,050 per ounce due to expectations that the U.S. Federal Reserve (Fed) will cut interest rates and increased demand for safe-haven assets. The Fed maintained its interest rate at 4.25%-4.50% but is expected to implement two rate cuts this year, which has strongly supported gold prices. Rising tensions in the Middle East have also boosted demand for gold, following Israel’s resumption of military operations in Gaza and continued U.S. airstrikes on Houthi targets in Yemen.
Additionally, the Trump administration's new import tax policy has raised concerns about slower economic growth and higher inflation. The U.S. dollar faced downward pressure as U.S. Treasury yields declined after the Fed announced a slowdown in balance sheet reduction.
Japan
The Japanese market today recorded an appreciation of the yen against the USD, trading around 148.25, driven by expectations that the U.S. Federal Reserve (Fed) will cut interest rates twice this year. The Bank of Japan (BoJ) kept its interest rate at 0.5% as expected, emphasizing caution amid rising global economic risks. Analysts believe that fluctuations in the USD/JPY exchange rate will be primarily influenced by external factors rather than domestic policy decisions.
Although the Japanese market was on holiday, the Nikkei futures index still edged up 0.2%. However, the recovery momentum in the Asian market was restrained by a sharp decline in Chinese stocks, overshadowing positive sentiment stemming from expectations of Fed monetary easing.
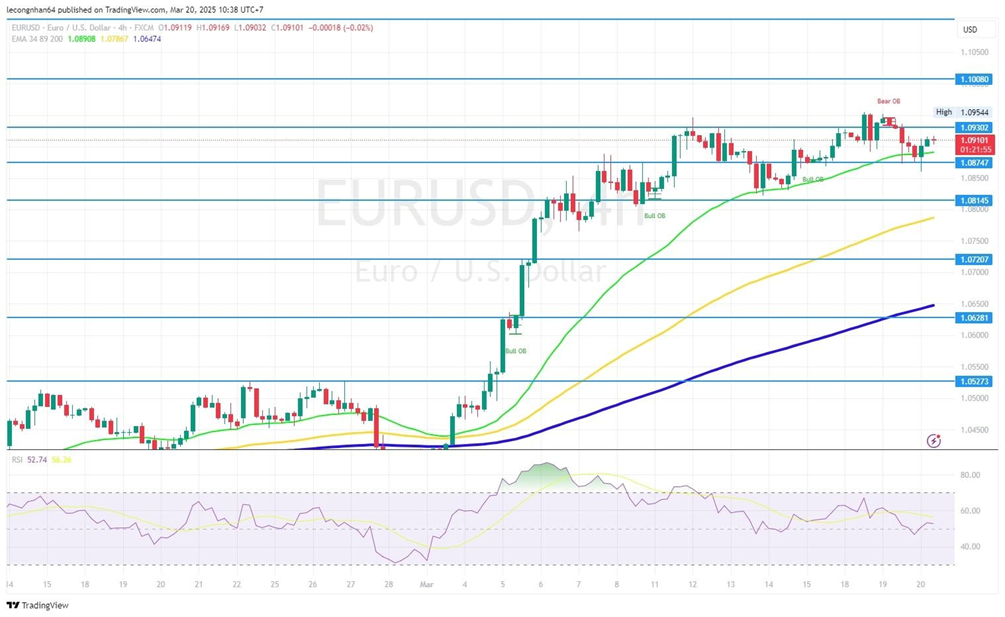
EUR/USD
Prediction: Increase
The EUR/USD pair remains in an uptrend with higher highs and higher lows. However, the price is currently facing strong resistance at 1.0930 and shows signs of a pullback. Profit-taking pressure emerged after the price hit this resistance level, but the overall trend remains intact. Investors should monitor key support levels to assess the potential for the uptrend to continue.
FUNDAMENTAL ANALYSIS
Monetary Policy and Fed Impact
The Fed maintained interest rates at the recent FOMC meeting but retained its forecast for two rate cuts (totaling 50 basis points) in 2025.
Fed Chair Jerome Powell emphasized there’s “no rush” to cut rates, creating a sense of caution in the market.
U.S. Treasury yields fell slightly, weakening the USD and supporting the EUR/USD's upward momentum.
The Trump administration's trade policies continue to create uncertainty with new import tariffs, raising concerns about inflation and slowing economic growth.
Inflation and Market Drivers
The Fed maintained its view that tariff-driven inflation could be temporary but raised its 2025 inflation forecast to 2.8%.
The weakening USD index helped EUR/USD hold above key support zones.
Gold prices hit a record high of $3,055.96/oz, indicating strong safe-haven demand.
Geopolitics and Market Sentiment
U.S. equities rallied following the Fed meeting, while Chinese stock markets experienced sharp declines due to profit-taking from previous gains.
The USD weakened, while EUR/USD held at its 5-month high of 1.0908.
The Bank of England (BoE) is set to announce its interest rate decision, which may impact the British pound and indirectly affect EUR/USD.
TECHNICAL ANALYSIS
Key Resistance Levels
● 1.0930 – The strongest current resistance zone. Breaking above this level may push EUR/USD toward 1.1008.
● 1.1008 – The next key resistance level; surpassing this would further solidify the uptrend.
Key Support Levels
● 1.0874 – A significant support zone aligning with the 34 EMA.
● 1.0814 – A deeper support zone near the 89 EMA.
● 1.0722 – A strong support area, marking previous lows.
Technical Indicators:
RSI: 52.74 – Currently in the neutral zone, showing no clear overbought or oversold signals. RSI previously reached a high and has since declined, indicating profit-taking pressure but no strong reversal signs.
The uptrend remains dominant, but EUR/USD is showing signs of consolidation after hitting the 1.0930 resistance level. Investors should closely monitor support zones at 1.0874 – 1.0814 for optimal entry points. A breakout above 1.0930 could signal continued upward momentum toward 1.1008. The market will remain influenced by Fed policy, Chinese stock volatility, and upcoming economic data.
BTCUSD
Prediction: Recovery with Strong Resistance Ahead
Bitcoin has seen a significant recovery from the $80,000 support zone and is now testing a key resistance area near $88,756. The upward momentum is slowing as the price approaches the 200 EMA, a crucial technical resistance. Whether BTC breaks through or fails at this level will determine its next direction.
FUNDAMENTAL ANALYSIS
Long-term Investors Accumulating Strongly
The Long-term Holder Net Position Change turned positive for the first time in 2025, indicating that long-term investors accumulated 167,000 BTC (approximately $14 billion USD) in March.
This strong accumulation reflects growing confidence in Bitcoin’s long-term uptrend, especially following the recent pullback to $80,000.
Bitcoin ETFs and Institutional Inflows
In addition to long-term accumulation, Bitcoin ETFs have shown positive inflows after weeks of outflows — a crucial factor supporting the recovery.
On March 17, Bitcoin ETFs attracted over $274.6 million USD, marking the largest single-day inflow in 28 days.
On March 18, another $209 million USD flowed into Bitcoin funds, reinforcing bullish sentiment.
Notably, this three-day inflow streak is the strongest ETF recovery since February 18, after a prolonged period of market stagnation. This trend reflects renewed institutional interest, strengthening positive market sentiment.
On-chain Activity
Bitcoin transaction volumes have dropped to their lowest levels since October 2023, suggesting cautious retail investor behavior.
Historically, such quiet periods have often preceded sharp market breakouts once new capital re-enters the space.
Political and Regulatory Developments
The U.S. Congress is currently discussing key bills related to Bitcoin and stablecoins, which could significantly impact market sentiment in the near future.
TECHNICAL ANALYSIS
Key Resistance Levels
● $88,756 – A strong resistance zone aligning with the 200 EMA. Breaking above this level could signal the end of Bitcoin’s downtrend and ignite a strong recovery.
● $92,095 – The next key resistance; a breakout here would confirm bullish momentum and potentially push BTC toward higher price zones.
Key Support Levels
● $83,784 – A crucial support zone aligning with the 34 EMA.
● $80,000 – A key psychological support level.
● $76,619 – A major support zone; losing this level could trigger a deeper correction.
● $73,864 – A firm support level that could act as a potential bottom if selling pressure intensifies.
Technical Indicators:
RSI: 61.96 – Currently in the positive zone, indicating bullish momentum, but showing slight signs of weakening.
Volume: Trading volume increased during the recent recovery, but not yet strong enough to confirm a sustained uptrend.

US30 (Dow Jones Industrial Average)
Prediction: Short-term Recovery Within a Larger Downtrend
The US30 index remains in a primary downtrend, characterized by lower highs and lower lows. However, there are signs of a short-term recovery after bouncing from the 40,653 support zone. Currently, the index is approaching a key resistance area at 42,103. This recovery is supported by the Fed’s decision to maintain interest rates, but potential risks from economic instability and the Trump administration’s trade policies could still pressure the market.
FUNDAMENTAL ANALYSIS
Monetary Policy and Fed Impact
The Fed maintained interest rates at 4.25% - 4.50%, aligning with market expectations. This eased concerns about aggressive monetary tightening in the near term.
The Fed also signaled plans to cut rates by 50 basis points in 2025, which has helped maintain positive investor sentiment.
Fed Chair Jerome Powell emphasized the Fed is "well-positioned to wait for clearer data" before making further rate cut decisions.
Additionally, the Fed announced plans to slow the pace of balance sheet reduction starting April 2025, which could improve market liquidity and ease pressure on equities.
Growth and Inflation
The Fed lowered its 2025 GDP growth forecast from 2.1% to 1.7%, below the estimated potential growth rate of 1.8%.
The Fed raised its PCE inflation forecast to 2.7% by the end of 2025, up from the previous forecast of 2.5%.
Slower growth combined with persistent inflation creates a challenging environment for equity markets.
Bond Yields and Market Impact
The 10-year Treasury yield dropped to 4.25%, while the 2-year Treasury yield declined to 3.98%. This easing in yields has reduced pressure on equity markets, encouraging risk appetite.
However, lingering inflation concerns and economic uncertainty may prompt the Fed to act cautiously on future rate cuts.
Market Sentiment and Geopolitical Risks
Wall Street responded positively to the Fed’s decision:
● Dow Jones rose 0.9% ● Nasdaq climbed 1.4%
● S&P 500 gained 1.1%
Consumer discretionary and energy sectors led the gains, reflecting strong interest in recovery-focused stocks. Rising trade tensions between the U.S. and China, coupled with new tax policies under the Trump administration, may trigger further volatility in equity markets.
TECHNICAL ANALYSIS
Key Resistance Levels
● 42,103 – Immediate resistance zone currently being tested. A breakout here could open the door for further recovery.
● 42,521 – A strong resistance level coinciding with the 200 EMA (blue line), likely to attract significant selling pressure.
● 43,070 and 43,334 – Additional resistance zones if bullish momentum strengthens.
Key Support Levels
● 41,733 – The nearest support level, crucial for sustaining the ongoing recovery.
● 40,684 and 40,653 – Strong support zones; a break below these levels would confirm the continuation of the primary downtrend.
Technical Indicators:
RSI: 64.11 – Approaching the overbought zone (70), indicating strong momentum but also suggesting a potential short-term pullback if bullish pressure weakens.
The US30 is showing positive signs of a short-term recovery, but the 42,103 resistance level remains a critical barrier. A successful breakout above this zone could signal further upside toward 42,521 and beyond. Conversely, failure to break resistance may lead to renewed downward pressure, with key support at 41,733 and 40,653 acting as crucial levels to watch.
Investors should closely monitor economic data releases, particularly inflation figures, which will heavily influence Fed policy and the Dow Jones' future direction.

Disclaimer
Derivative investments involve significant risks and may result in the loss of the capital you invest. You are advised to carefully read and study the legality of the company, products, and trading rules before deciding to invest your money. Be responsible and accountable in your trading.
RISK WARNING IN TRADING
Transactions via margin involve products that use leverage mechanisms, carry high risks, and are certainly not suitable for all investors. THERE IS NO GUARANTEE OF PROFIT on your investment, so be wary of those who guarantee profits in trading. You are advised not to use funds if you are not prepared to incur losses. Before deciding to trade, ensure that you understand the risks involved and also consider your experience.

