
BTCUSD Bearish Outlook: Key Support Levels to Watch Below $90,000

Market Overview
Cryptocurrency
The crypto market saw high volatility, with Bitcoin dropping from $96,000 to $78,258 before recovering to $95,000, then falling below $90,000. BTC’s SOPR index declined to 0.95, indicating short-term investors are selling at a loss, which could signal a market bottom. Despite strong buying pressure following Trump’s Crypto Reserve announcement, experts remain skeptical about the sustainability of the rally.
Bitcoin is currently trading around $83,843, with key support at $82,250 and $80,000. A break below could push prices toward $76,000, while surpassing $88,500 may drive BTC to $92,000. Upcoming economic events like the NFP report and the White House Crypto Summit will significantly influence market trends.
U.S. Stock Market
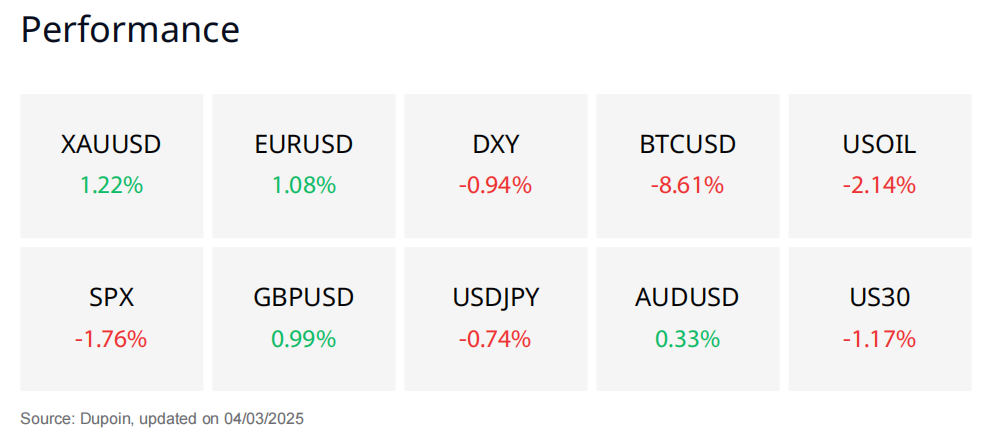
The U.S. stock market plunged after Trump imposed a 25% tariff on Canada and Mexico, along with an additional 10% tariff on China. The S&P 500 dropped 1.76%, the Nasdaq fell 2.64%, and the Dow Jones declined 1.47%. Tech stocks like Nvidia (-8.7%) and Tesla (-2.8%) faced heavy selling pressure. Investors shifted to bonds, pushing yields to their lowest levels since October, while the U.S. dollar weakened amid expectations of more Fed rate cuts this year.
U.S. stock futures stabilized after the selloff, but concerns over long-term tariff impacts remain. Analysts suggest this could be a Trump negotiation tactic, yet it raises the risk of an economic slowdown. Investors are closely watching key economic data this week, including the NFP jobs report and Fed statements, to assess market outlooks.
BTCUSD
Prediction: Bearish
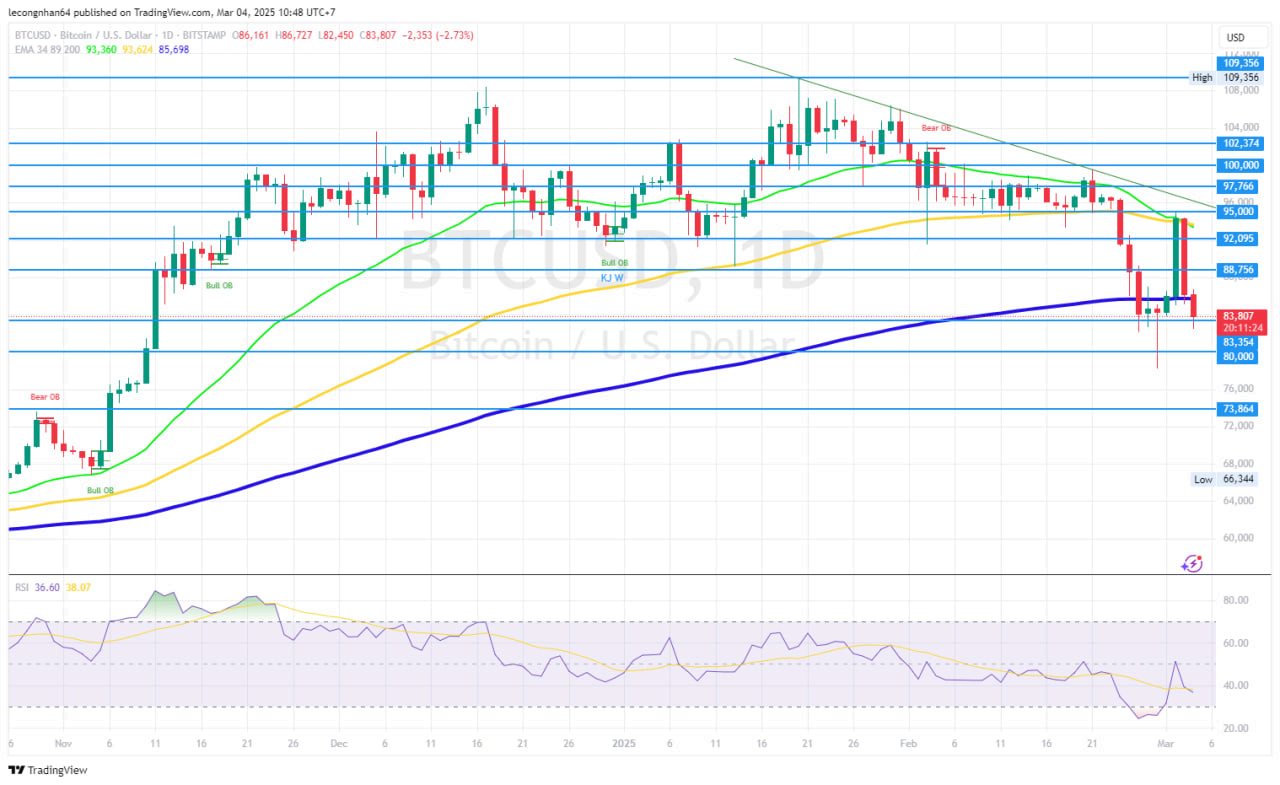
Bitcoin continues its strong downtrend after failing to hold the $95,000 resistance zone. Currently, the price is trading below $90,000 and risks further decline if it fails to sustain above the criticalsupport zone of $82,250 - $80,000.
FUNDAMENTAL ANALYSIS
Monetary Policy & Fed Impact
Investors are closely watching the PMI (Purchasing Managers' Index) data on Wednesday. If PMI is weak, expectations of a rate cut could rise, providing support for BTC. On the other hand, strong data could push the Fed to maintain tight monetary policy, putting pressure on Bitcoin.
The Non-Farm Payrolls (NFP) report on Friday is also a key event. If the labor market remains strong, it could reduce the chances of Fed easing, making BTC's recovery more challenging. Trump Announces "US Crypto Strategic Reserve"
Bitcoin surged to $95,000 over the weekend following news that Donald Trump announced the establishment of the "US Crypto Strategic Reserve." However, after this sharp rally, BTC quickly retracted as the market weighed the feasibility of this policy.
Some analysts, including QCP Capital, compared this rally to the "Xi Candle" of 2019, when Bitcoin surged following a statement from Chinese President Xi Jinping, only to reverse sharply afterward.
Geopolitical Tensions & Trade Policy
Trump’s administration continues to impose new tariffs, pressuring financial markets. This could weaken risk sentiment and negatively impact Bitcoin.
US-Russia relations and Ukraine negotiations remain uncertain, potentially increasing demand for gold as a safe haven rather than Bitcoin.
Coinbase vs. SEC Legal Battle
Coinbase has filed a FOIA request to investigate SEC expenses related to lawsuits against the crypto industry.
If the SEC reduces legal actions against crypto firms following a Trump re-election, it could be a positive sign. However, it might not be enough to trigger a sustained BTC uptrend.
TECHNICAL ANALYSIS
Key Resistance Levels
● $86,000 – Immediate resistance, aligned with the 200-day EMA. If BTC fails to break above, the downtrend could continue.
● $92,000 – Strong resistance, previously a key support zone when BTC was consolidating between $92K - $109K.
Key Support Levels
● $82,250 – Short-term support. A breakdown below this level could trigger increased selling pressure.
● $80,000 – Strong support. If breached, BTC may drop to $78,500 - $76,000.
● $75,000 – Major support. If BTC reaches this level, the risk of a deeper correction increases.
Technical Indicators:
EMA 200 (85,698): BTC is trading below the 200-day EMA, indicating continued weakness in the long-term trend.
RSI (36.60): Currently in mild oversold territory, but no clear reversal signals. If RSI drops below 30, a technical rebound might occur.
Investors should closely monitor this week’s economic data (PMI, NFP) and policy developments from the Trump administration to adjust their trading strategies accordingly.
XAUUSD
Prediction: Recovery
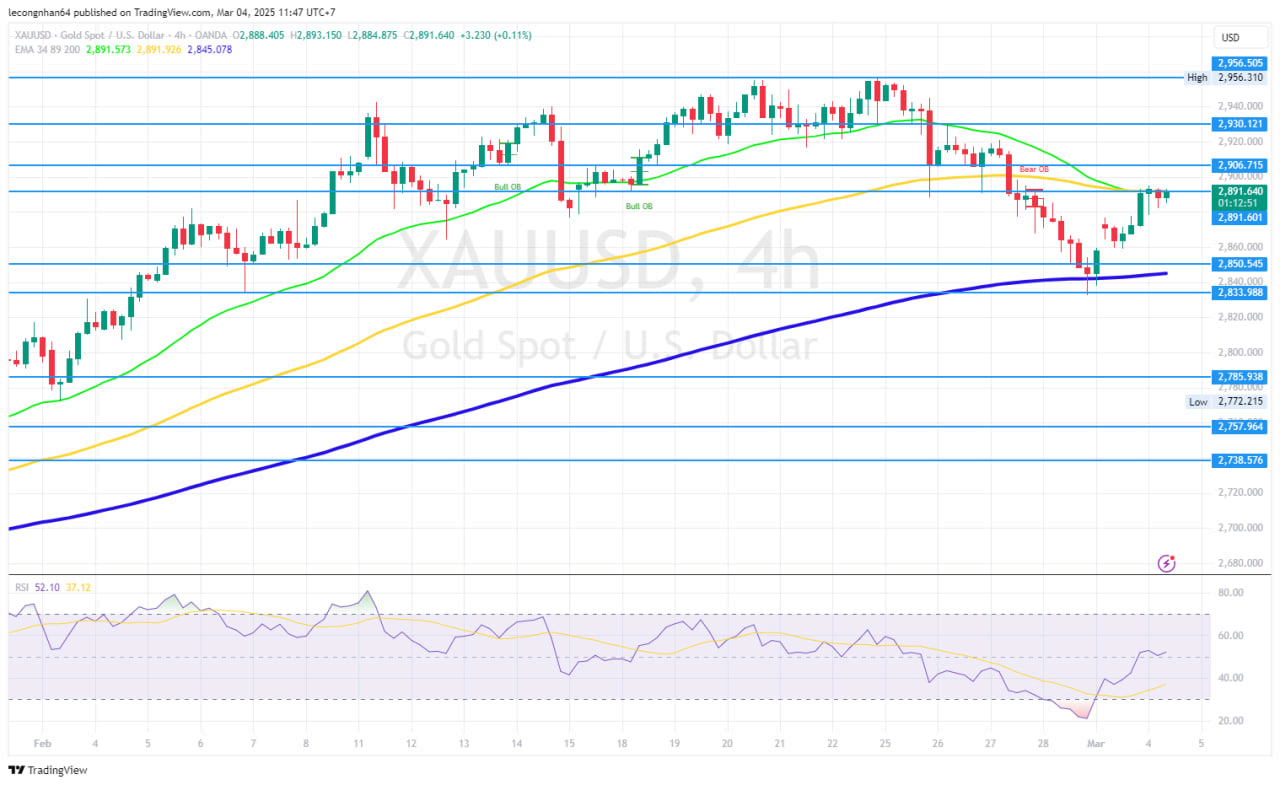
Gold is currently fluctuating around $2,890 after a sharp decline from its $2,956 peak. While technical corrections are exerting pressure, macroeconomic and geopolitical factors are providing strong support. Investors should closely monitor price reactions at key support levels to determine the next trend.
FUNDAMENTAL ANALYSIS
1. Monetary Policy & Fed Impact
Inflation may remain high due to new tariffs imposed by President Donald Trump on Canada, Mexico, and China, driving up commodity prices. This could force the Fed to maintain high interest rates longer, putting downward pressure on gold. However, U.S. 10-year Treasury yields have dropped to 4.175%, and the USD has weakened, helping gold remain at elevated levels.
The market is awaiting key economic data:
ADP Employment Report (Wednesday)
Non-Farm Payrolls (Friday)
These will influence the Fed’s next rate decision.
2. U.S. Labor Market & Economic Outlook
Manufacturing data in the U.S. is slowing, raising concerns about a potential economic recession. St. Louis Fed President Alberto Musalem has expressed concerns over weak consumer demand, which could negatively impact economic growth.
3. Geopolitical Tensions & Market Sentiment
Trade tensions escalate as Trump imposes a 25% tariff on Mexico and Canada and raises Chinese tariffs to 20%, increasing inflation risks and global economic instability, supporting gold’s
safe-haven demand.
Trump’s meeting with Ukrainian President Zelensky ended in tension, raising concerns about U.S. support for Ukraine and the potential for prolonged conflict.
JPMorgan forecasts gold could reach $3,000/oz in Q4 2025, reflecting a long-term bullish outlook for precious metals.
TECHNICAL ANALYSIS
Key Resistance Levels
● $2,892 – Immediate resistance, aligned with the EMA 34 and EMA 89 (Bear Order Block). A breakout above this level could extend the rally.
● $2,930 – Stronger resistance. If broken, gold could retest its previous peak at $2,956.
Key Support Levels
● $2,850 - $2,845 – Strong support zone, aligned with the rising EMA 200. Holding above this level would keep the bullish trend intact.
● $2,820 - $2,833 – Deeper support. A breakdown could push prices towards $2,785.
Technical Indicators:
RSI (52.10) – Recovering from oversold territory but not strong enough to confirm a sustained rally yet.
EMA 34 crossing below EMA 89 – Indicates short-term bearish momentum, suggesting that sellers still have the upper hand. However, price remains above EMA 200, meaning the long-term uptrend is still intact.
Trading volume – Remains stable, indicating that investors are waiting for key economic data before committing to a direction.
Monitor economic data (ADP, NFP) and geopolitical developments for potential volatility.
USOIL (WTI Crude Oil)
Prediction: Decrease
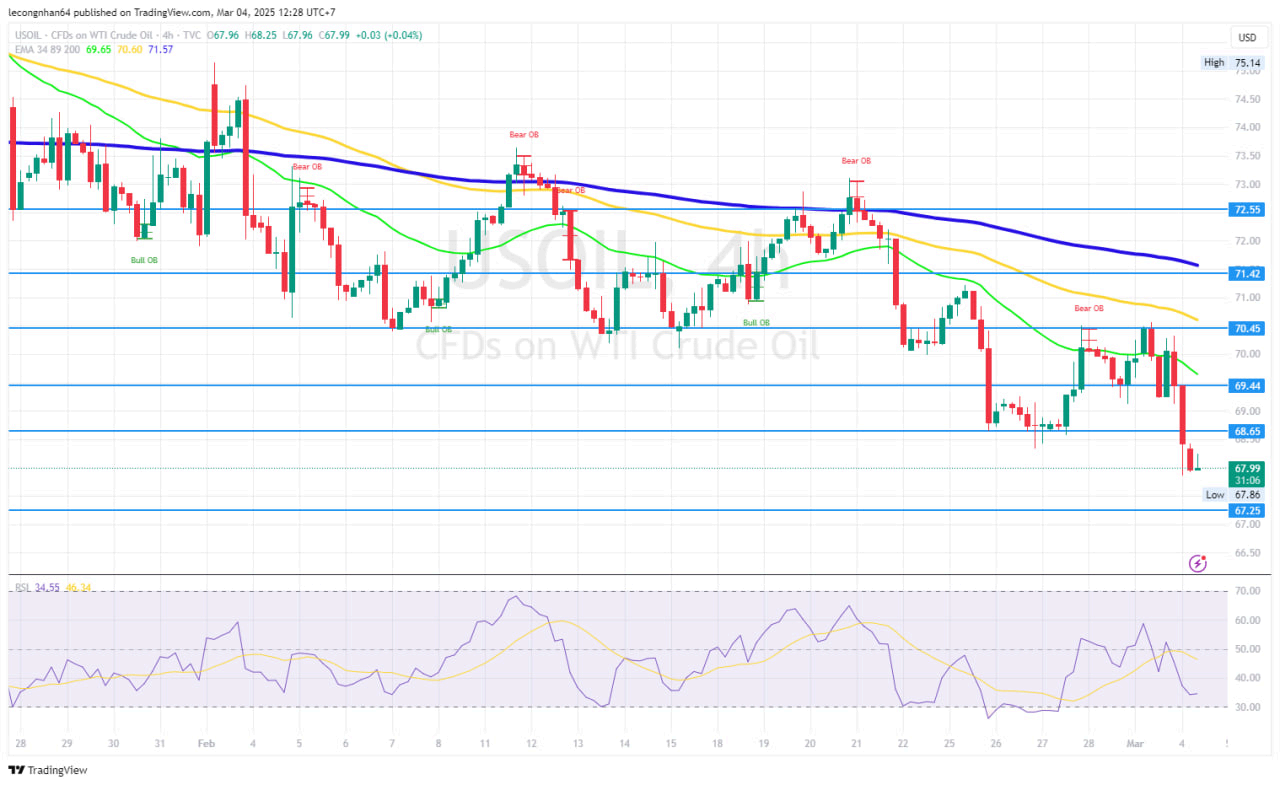
WTI crude oil continues its strong downtrend, with lower highs and lower lows forming. Currently, oil is trading around $67.99, near the critical $67.25 support zone. Technical indicators suggest that selling pressure remains dominant, though a slight rebound may occur if buying interest emerges at support levels.
FUNDAMENTAL ANALYSIS
1. OPEC+ Policy & Oil Supply
OPEC+ confirmed an increase in oil production by 138,000 barrels per day starting April 2025, marking the first production hike since 2022. This has raised concerns about oversupply, putting downward pressure on oil prices.
Russia could benefit if the U.S. eases sanctions related to Ukraine, potentially allowing more Russian oil to enter global markets.
Goldman Sachs notes that Russia’s current production limitations are more due to OPEC+ commitments than sanctions, meaning a relaxation of sanctions may not significantly boost Russian oil output.
2. U.S. Tariffs & Oil Demand Impact
The Trump administration has officially imposed a 25% tariff on imports from Canada and Mexico and raised Chinese import tariffs from 10% to 20%.
These tariff measures have sparked concerns about slower global economic growth, which could lead to weaker energy demand, further pressuring oil prices.
The U.S. dollar is weakening as 10-year Treasury yields drop to 4.115%, the lowest level since October 2024, reflecting fears of slowing U.S. economic growth.
3. Geopolitical Risks & Market Sentiment
Trump has paused military aid to Ukraine, fueling speculation that the U.S. may ease sanctions on Russia. If this happens, increased Russian oil exports could further depress prices.
Global stock markets have experienced significant declines, reflecting heightened risk aversion:
● S&P 500 down 1.8%
● Nasdaq down 2.6%
● Japan’s Nikkei 225 down 2.2%
This increased risk-off sentiment is weighing on crude oil demand.
Canadian Dollar (CAD) and Mexican Peso (MXN) are weakening, reflecting the negative impact of U.S. tariffs on Canada and Mexico, two major oil trade partners with the U.S.
TECHNICAL ANALYSIS
Key Resistance Levels
● $68.65 – Immediate resistance. If oil rebounds but fails to break this level, the downtrend is likely to continue.
● $69.44 – Stronger resistance, aligned with EMA 34, where buyers might take profits if a rebound occurs.
● $70.45 - $71.42 – Major resistance zone. If oil recovers further, this level could attract heavy selling pressure.
Key Support Levels
● $67.25 – Critical support. If prices hold above this level, a technical rebound could be possible.
● $66.50 – If broken, oil could decline further toward $65 or lower.
Technical Indicators:
EMA 34, EMA 89, and EMA 200: Oil is trading below all three EMAs, confirming the dominance of the downtrend.
EMA 34 crossing below EMA 89 (D1): Further strengthens the bearish outlook.
Trading Volume: No major spikes, indicating that the downtrend remains intact without strong reversal signals yet.
Watch for U.S. economic data (tariffs, Fed policy) and OPEC+ developments to assess further price movements.
Disclaimer
Derivative investments involve significant risks and may result in the loss of the capital you invest. You are advised to carefully read and study the legality of the company, products, and trading rules before deciding to invest your money. Be responsible and accountable in your trading.
RISK WARNING IN TRADING
Transactions via margin involve products that use leverage mechanisms, carry high risks, and are certainly not suitable for all investors. THERE IS NO GUARANTEE OF PROFIT on your investment, so be wary of those who guarantee profits in trading. You are advised not to use funds if you are not prepared to incur losses. Before deciding to trade, ensure that you understand the risks involved and also consider your experience.
