
XAUUSD Technical Analysis: Key Support and Resistance Levels to Watch
XAUUSD
Prediction: Recovery
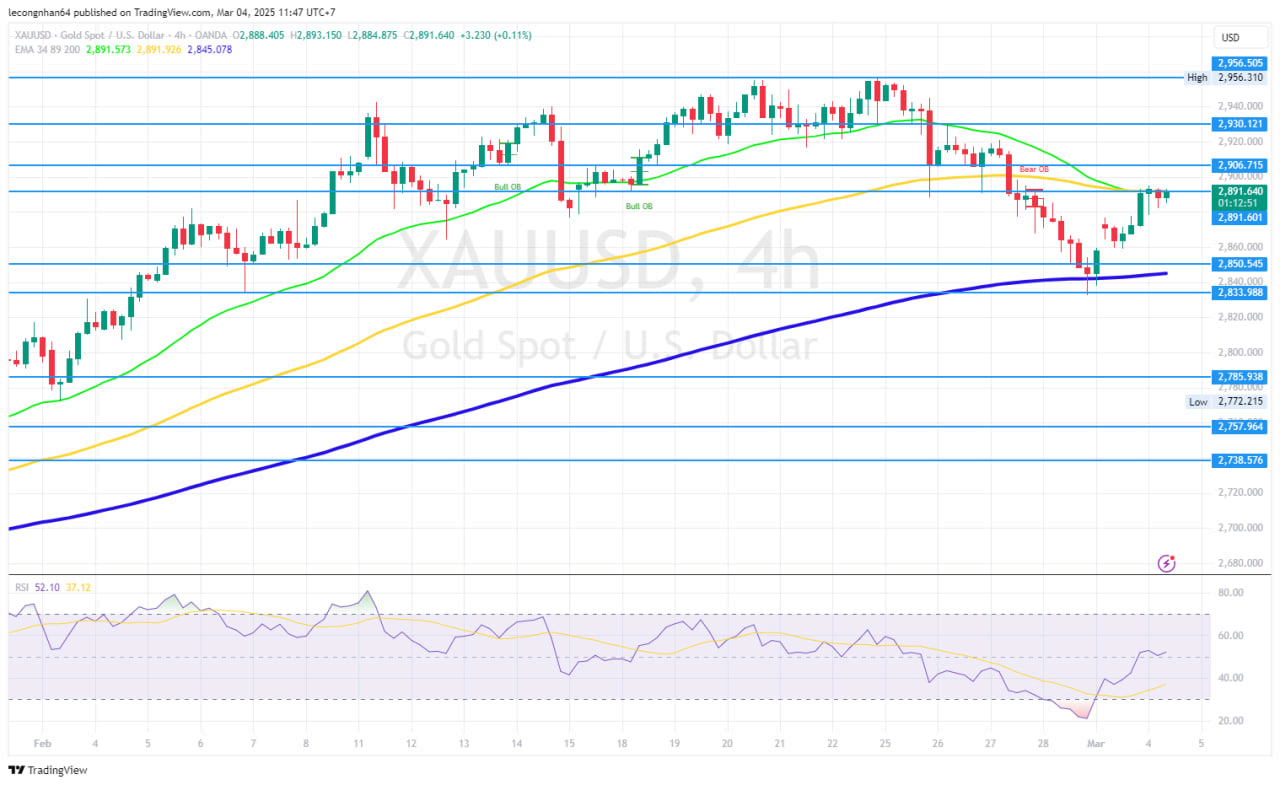
Gold is currently fluctuating around $2,890 after a sharp decline from its $2,956 peak. While technical corrections are exerting pressure, macroeconomic and geopolitical factors are providing strong support. Investors should closely monitor price reactions at key support levels to determine the next trend.
FUNDAMENTAL ANALYSIS
1. Monetary Policy & Fed Impact
Inflation may remain high due to new tariffs imposed by President Donald Trump on Canada, Mexico, and China, driving up commodity prices. This could force the Fed to maintain high interest rates longer, putting downward pressure on gold. However, U.S. 10-year Treasury yields have dropped to 4.175%, and the USD has weakened, helping gold remain at elevated levels.
The market is awaiting key economic data:
ADP Employment Report (Wednesday)
Non-Farm Payrolls (Friday)
These will influence the Fed’s next rate decision.
2. U.S. Labor Market & Economic Outlook
Manufacturing data in the U.S. is slowing, raising concerns about a potential economic recession. St. Louis Fed President Alberto Musalem has expressed concerns over weak consumer demand, which could negatively impact economic growth.
3. Geopolitical Tensions & Market Sentiment
Trade tensions escalate as Trump imposes a 25% tariff on Mexico and Canada and raises Chinese tariffs to 20%, increasing inflation risks and global economic instability, supporting gold’s
safe-haven demand.
Trump’s meeting with Ukrainian President Zelensky ended in tension, raising concerns about U.S. support for Ukraine and the potential for prolonged conflict.
JPMorgan forecasts gold could reach $3,000/oz in Q4 2025, reflecting a long-term bullish outlook for precious metals.
TECHNICAL ANALYSIS
Key Resistance Levels
● $2,892 – Immediate resistance, aligned with the EMA 34 and EMA 89 (Bear Order Block). A breakout above this level could extend the rally.
● $2,930 – Stronger resistance. If broken, gold could retest its previous peak at $2,956.
Key Support Levels
● $2,850 - $2,845 – Strong support zone, aligned with the rising EMA 200. Holding above this level would keep the bullish trend intact.
● $2,820 - $2,833 – Deeper support. A breakdown could push prices towards $2,785.
Technical Indicators:
RSI (52.10) – Recovering from oversold territory but not strong enough to confirm a sustained rally yet.
EMA 34 crossing below EMA 89 – Indicates short-term bearish momentum, suggesting that sellers still have the upper hand. However, price remains above EMA 200, meaning the long-term uptrend is still intact.
Trading volume – Remains stable, indicating that investors are waiting for key economic data before committing to a direction.
Monitor economic data (ADP, NFP) and geopolitical developments for potential volatility.
Disclaimer
Derivative investments involve significant risks and may result in the loss of the capital you invest. You are advised to carefully read and study the legality of the company, products, and trading rules before deciding to invest your money. Be responsible and accountable in your trading.
RISK WARNING IN TRADING
Transactions via margin involve products that use leverage mechanisms, carry high risks, and are certainly not suitable for all investors. THERE IS NO GUARANTEE OF PROFIT on your investment, so be wary of those who guarantee profits in trading. You are advised not to use funds if you are not prepared to incur losses. Before deciding to trade, ensure that you understand the risks involved and also consider your experience.
