
BTC/USD Under Pressure: Impact of Fed Rate Cuts and Crypto ETF Hopes

XAU/USD
Prediction: Increase
Gold prices remain in a strong uptrend, with higher highs and higher lows in recent sessions. Currently, the price is showing signs of a pullback after reaching $2,942.780 (the most recent high). Profit-taking pressure has emerged, but it has not yet altered the overall trend structure. Investors should monitor key support levels to assess the possibility of a continued uptrend.
FUNDAMENTAL ANALYSIS
Monetary Policy and Fed Impact:
The U.S. Federal Reserve (Fed) continues to maintain a cautious monetary policy. The market currently expects the Fed to keep interest rates unchanged in the near term, with the potential for two rate cuts (totaling 45 basis points) in 2025.
The U.S. 10-year Treasury yield has fallen to 3.95%, its lowest level in over a month, reducing the appeal of the USD and thereby supporting gold prices.
Inflation and Market Drivers:
The 25% tariff on all steel and aluminum imports into the U.S. continues to raise concerns about inflation and economic instability.
The U.S. Consumer Price Index (CPI) will be released on Wednesday, followed by the Producer Price Index (PPI) on Thursday. If inflation data exceeds expectations, the Fed may keep interest rates higher for longer, potentially putting pressure on gold prices.
The labor market remains stable, with the unemployment rate holding at 4%, not strong enough to shift the Fed's monetary policy stance.
Geopolitics and Market Sentiment:
U.S.-China trade tensions are escalating as the Trump administration announces new tariffs on Chinese imports, which could weaken global economic growth and boost demand for gold as a safe-haven asset.
Hamas has suspended the release of Israeli hostages, increasing the risk of escalating conflict in Gaza, further reinforcing gold's status as a safe-haven asset.
The People's Bank of China (PBoC) continued its gold purchases in January 2025, marking the third consecutive month of increased gold reserves, reflecting confidence in the precious metal.
The Bank of England (BoE) has just cut interest rates with a more dovish stance than expected, providing additional support for gold prices.
TECHNICAL ANALYSIS
Key Resistance Levels
● $2,942.845: Recent high; if broken, the price may target $2,960 or higher.
● $2,908.251: Closest resistance level.
Key Support Levels
● $2,882.073: Current support zone; if the price holds above this level, the uptrend could continue.
● $2,850.545: Stronger support level.
● $2,823.420: Critical support level, aligning with the 89 EMA.
RSI: Currently at 56.26, after previously reaching 80.83 (overbought). The RSI is now declining, indicating correction pressure but no signs of a trend reversal yet.
Trading Volume: Trading volume remains high, signaling strong investor interest in gold. If volume drops significantly in upcoming sessions, a deeper correction could occur.
Price Action: Watch price reaction at $2,882 to determine buy/sell decisions. If the price rebounds from this level, buying opportunities could emerge with targets at $2,908 - $2,942. If support breaks, monitor lower levels to identify a safe entry point.
Investors should closely monitor upcoming economic data, particularly the U.S. CPI report and Fed policy decisions, to adjust their trading strategies accordingly.

EUR/USD
Prediction: Increase
The EUR/USD pair is maintaining a short-term uptrend, supported by expectations of a dovish Fed policy and increasing risk sentiment in the market. Market sentiment currently favors risk assets, weakening the USD and providing momentum for the Euro.
FUNDAMENTAL ANALYSIS
Monetary Policy and the Fed:
The Federal Reserve (Fed) is reassessing its interest rate policy as inflationary pressures gradually ease. Investors expect the Fed to keep interest rates unchanged in the near term, with a potential 45 basis point rate cut this year.
Upcoming CPI and PPI reports will play a crucial role in determining the Fed's direction. If inflation comes in lower than expected, the USD could weaken, allowing EUR/USD to rise. European Central Bank (ECB):
The ECB remains cautious, with a potential rate cut in the second half of the year if Eurozone economic growth does not improve.
Eurozone inflation remains on a downward trend but is declining slower than expected, reducing the likelihood of an early rate cut by the ECB.
Stock Market and Market Sentiment:
Both Asian and Wall Street stock markets are rising, indicating that risk sentiment is returning. As demand for risk assets increases, the USD may weaken, supporting EUR/USD.
U.S. Treasury yields have dropped to their lowest level in over a month, reducing the attractiveness of the USD compared to the EUR.
Geopolitics and Global Factors:
U.S.-China trade tensions have eased after China maintained a stable yuan policy, reducing safe-haven demand for the USD.
In Japan, the Japanese yen has strengthened due to expectations that the Bank of Japan (BOJ) will continue raising interest rates, indirectly affecting capital flows into the USD and EUR.
The Bank of England (BoE) may cut interest rates, impacting the GBP and indirectly influencing the EUR.
The Reserve Bank of India (RBI) may loosen controls on the rupee, causing it to depreciate, but this is unlikely to have a significant impact on EUR/USD.
TECHNICAL ANALYSIS
Key Resistance Levels
● 1.03749 – Price is approaching this level, which could act as a reversal point.
● 1.04326 – Bearish Order Block (OB) zone, strong selling pressure expected.
● 1.05001 – Critical high; a breakout above this level could shift the trend.
Key Support Levels
● 1.03398 – Nearest support; if broken, a deeper decline may occur.
● 1.02896 – Important level; price could drop here if the downtrend continues.
● 1.02221 – Strong support, previously formed a bottom.
RSI: Currently at 56.24. If RSI surpasses 60, it may confirm a short-term uptrend.
EMA levels:
● EMA 34 & EMA 89 – Price is attempting to break above these levels, indicating a
short-term recovery.
● EMA 200 – Price has yet to break above this level, suggesting the overall downtrend still dominates.
Price Action: If the price breaks above 1.03749 with a confirmed candle close, a buy position could be considered with a target of 1.04326. RSI needs to exceed 60 to confirm bullish momentum.

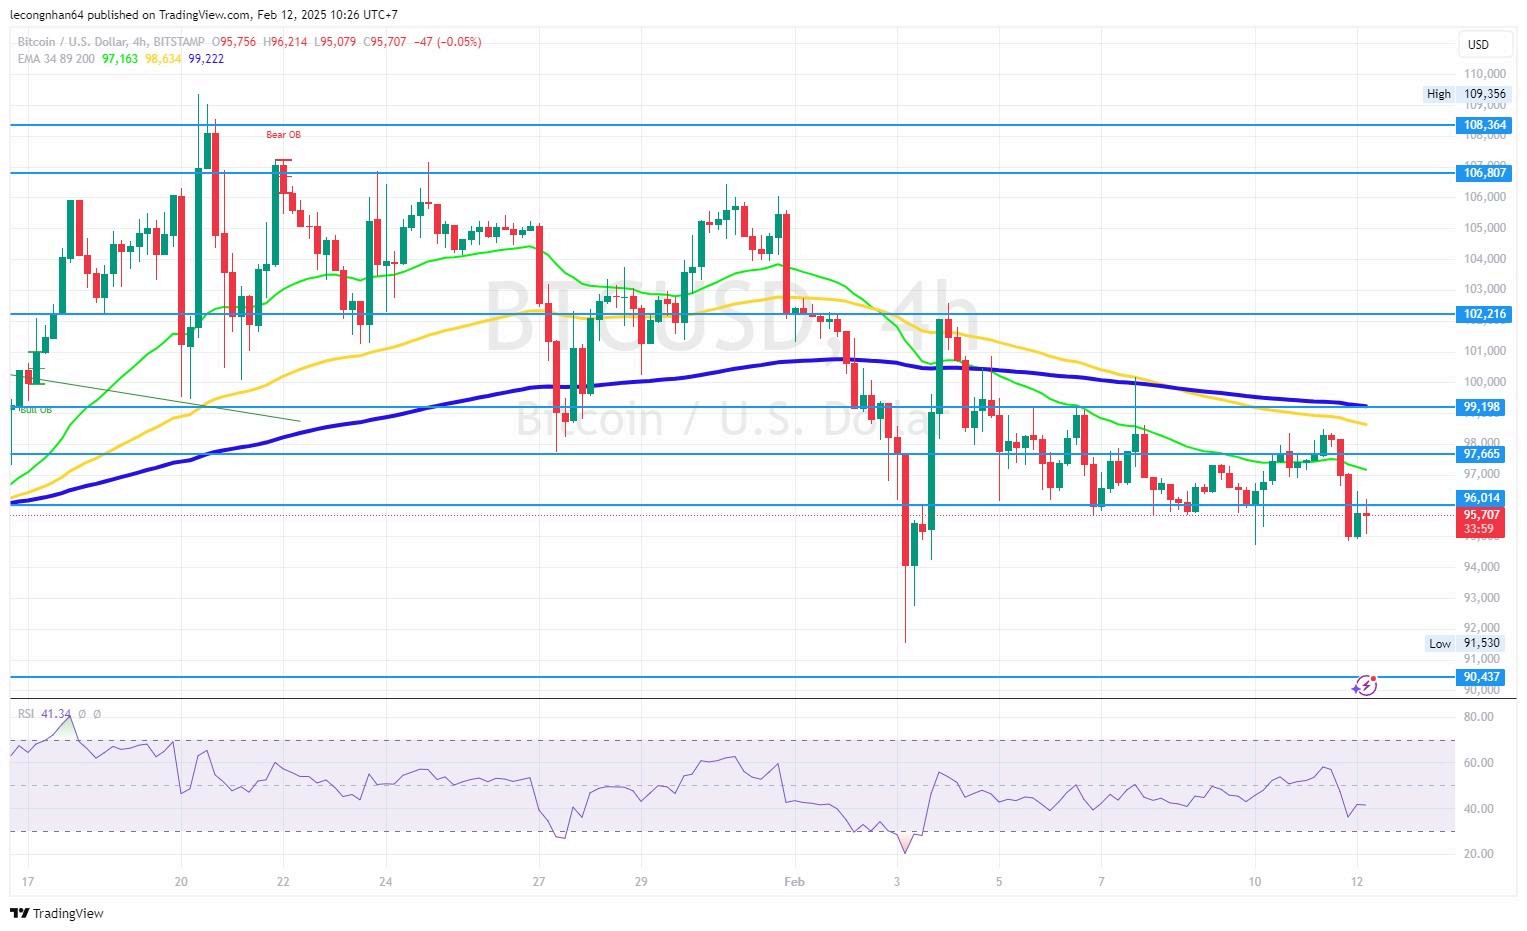
BTC/USD
Prediction: Decrease
BTC/USD remains in a broader downtrend as the price trades below key EMAs. Currently, the price is testing the $95,000 support zone and may see a short-term rebound before continuing downward.
FUNDAMENTAL ANALYSIS
Monetary Policy and Fed Impact:
Fed Interest Rates: The market expects the Fed to cut interest rates twice in 2024, lowering the opportunity cost of holding Bitcoin and providing upward momentum.
U.S. Economic Data: CPI and PPI reports will be released this week. If inflation cools, expectations for Fed rate cuts will increase, potentially supporting Bitcoin’s price.
Crypto Market Factors:
Exchange Outflows: BTC is being moved from exchanges to personal wallets and ETFs, signaling long-term accumulation and potentially limiting short-term selling pressure.
Declining Leverage Ratio: A drop in leverage across the derivatives market reduces the risk of liquidations, helping to stabilize BTC prices and support bullish momentum.
Regulatory Policies and SEC Influence:
SEC Halts Binance Lawsuit: The SEC and Binance have reached a 60-day agreement to pause the lawsuit, easing regulatory concerns for the crypto market and potentially attracting investment back into the space.
SEC Crypto Task Force: The creation of a new SEC task force could shape future regulatory approaches. A more favorable stance may create a more supportive environment for crypto.
ETF Opportunities and Litecoin ETF Outlook:
Franklin Templeton’s Crypto Index ETF Filing: If approved by the SEC, this ETF could drive Bitcoin demand.
Litecoin ETF Expectations: Bloomberg analysts predict a 90% chance of Litecoin ETF approval in 2025. A positive outcome could boost sentiment across the crypto market, indicating growing regulatory acceptance.
TECHNICAL ANALYSIS
Key Resistance Levels
● $97,665 – $99,198: Initial resistance zone, aligning with the 200 EMA.
● $102,216: Strong resistance; significant selling pressure expected.
● $106,807 – $108,364: Bearish Order Block (OB) zone, where selling pressure could increase if the price approaches.
Key Support Levels
● $96,014: Nearest support; price has bounced from this level.
● $94,000 – $93,500: Next support zone; could be tested if BTC loses the $96,014 level.
● $91,530 – $90,437: Recent lows, potential bottom formation area.
EMA: Price remains below the EMA 200, EMA 89, and EMA 34 confirming that the downtrend still dominates.
RSI: Currently at 39.73, in the neutral range (30-50), indicating that selling pressure remains strong. If RSI falls below 30, BTC could enter oversold territory, potentially triggering a rebound.
Disclaimer
Derivative investments involve significant risks and may result in the loss of the capital you invest. You are advised to carefully read and study the legality of the company, products, and trading rules before deciding to invest your money. Be responsible and accountable in your trading.
RISK WARNING IN TRADING
Transactions via margin involve products that use leverage mechanisms, carry high risks, and are certainly not suitable for all investors. THERE IS NO GUARANTEE OF PROFIT on your investment, so be wary of those who guarantee profits in trading. You are advised not to use funds if you are not prepared to incur losses. Before deciding to trade, ensure that you understand the risks involved and also consider your experience.
