
Market Insights
Bitcoin's Price Battle: Buyers vs. Sellers - Who Will Prevail

XAU/USD
Prediction: Decrease
Fundamental Analysis:
The appeal of gold as a safe-haven asset has diminished due to news of a potential ceasefire between Israel and Hezbollah and Donald Trump nominating Scott Bessent as U.S. Treasury Secretary. This caused a sharp drop in gold prices, which fell by over 3%. On Monday, spot gold closed at $2,625.32 per ounce, marking a decline of $90.53, the largest drop since June 7. The reported draft ceasefire deal between Israel and Lebanon, which includes provisions for Israeli forces to withdraw from southern Lebanon and Hezbollah moving heavy weapons, led to increased selling pressure on gold. A U.S.-led monitoring committee is proposed to oversee the ceasefire agreement and address violations.
Technical Analysis:
Gold’s rally was halted on Monday as it dropped below $2,700 and continued downward, breaking the $2,630 level. The next support level is at $2,600. If this fails, gold may fall further to the 100-day moving average at $2,562, and then to the November 14 low of $2,536. If buying pressure returns and gold regains momentum above the 50-day moving average, it may target $2,700 again. A breakout above $2,700 could push gold to $2,750 and eventually to its all-time high of $2,790. However, oscillators like the Relative Strength Index (RSI) are currently bearish, indicating that sellers are in control.

USD/JPY
Prediction: Increase
Fundamental Analysis:
While traders are reducing bullish positions on the U.S. Dollar after its recent rally, uncertainty surrounding the Bank of Japan’s (BoJ) stance on interest rates, along with a positive market sentiment, may limit substantial gains for the JPY. The anticipation of U.S. President-elect Donald Trump's policies pushing inflation higher and slowing down Federal Reserve rate cuts could support U.S. bond yields, benefiting the USD. This provides a solid foundation for the USD/JPY pair.
Technical Analysis:
The USD/JPY pair remains below the 100-period Simple Moving Average (SMA), signaling potential further declines. The pair may find support around the 153.30-153.25 zone, with the next key support at the 153.00 level. A break below this could lead to bearish momentum, pushing the pair toward the mid-152.00s and the 200-day SMA near 152.00. On the upside, initial resistance is at 154.00, followed by 154.40. A sustained rise above 154.40 could push the pair toward the 155.00 and 155.40-155.50 zones. Strength beyond this could retest the multi-month high near 156.75 reached on November 15.

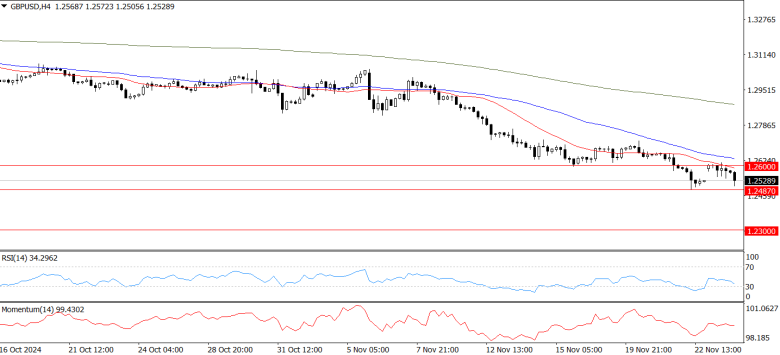
GBP/USD
Prediction: Decrease
Fundamental Analysis:
The UK’s economic calendar is light this week, with limited data releases, while the U.S. will see key inflation data on Wednesday. The improving global risk appetite has slightly weakened the U.S. Dollar, giving the Pound a modest boost, keeping GBP/USD just below the 1.2600 level. With limited data from the UK, and most of the U.S. market focus on Tuesday and Wednesday ahead of the Thanksgiving holiday, the market could remain relatively stable. The Federal Open Market Committee (FOMC) will release its Meeting Minutes on Tuesday, providing insights into the Fed’s interest rate decisions.
Technical Analysis:
GBP/USD remains below 1.2600, stabilizing above 1.2500 after dropping from its early-November range near 1.3000. The pair recently hit a six-month low of 1.2487. In the short term, bulls may attempt a recovery toward the 200-day Exponential Moving Average (EMA) at around 1.2840. However, long-term bears may target the 2024 lows near 1.2300.
BTC/USD
Prediction: Increase
Fundamental Analysis:
Bitcoin has experienced a short-term rebound but has not fully recovered from recent losses. The sell-off, driven by forced liquidations, particularly from long-term holders (LTH) who bought Bitcoin 6-12 months ago, continues. These holders, whose average cost basis is much higher than the current market price of around $57,900, are major sellers in the market. The financial markets are currently in a delicate balance between buyers and sellers, with short-term bearish sentiment prevailing over long-term buyers.
Technical Analysis:
Bitcoin is undergoing profit-taking by short-term buyers, pulling its price down to the upward trendline. If it bounces strongly from this level, it suggests that buyers are stepping in. Bulls may attempt to push Bitcoin above $100,000, targeting $113,331 and then $125,000. If the price falls below the upward trendline, it could decline to the 20-day moving average at $89,213, a critical level for buyers to defend. A break below this could push Bitcoin further down to $85,000.

Disclaimer
Derivative investments involve significant risks and may result in the loss of the capital you invest. You are advised to carefully read and study the legality of the company, products, and trading rules before deciding to invest your money. Be responsible and accountable in your trading.
RISK WARNING IN TRADING
Transactions via margin involve products that use leverage mechanisms, carry high risks, and are certainly not suitable for all investors. THERE IS NO GUARANTEE OF PROFIT on your investment, so be wary of those who guarantee profits in trading. You are advised not to use funds if you are not prepared to incur losses. Before deciding to trade, ensure that you understand the risks involved and also consider your experience.
