
EUR/USD Faces Continued Decline Amid Strong US Dollar Momentum

XAUUSD
Prediction: Decrease
Fundamental Analysis:
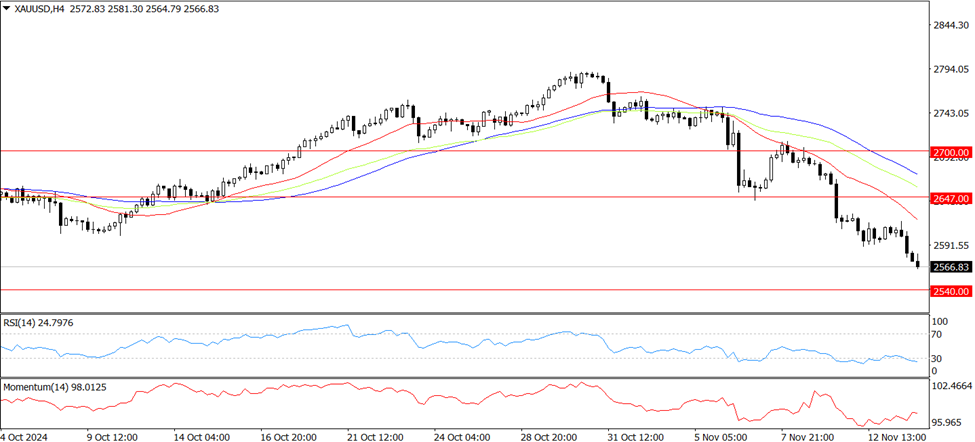
Spot gold prices fell by $25.39, or 0.98%, on Wednesday, closing at $2,572.64 per ounce. This decline was driven by a stronger US dollar following the release of the US Consumer Price Index (CPI) report. Market participants are closely monitoring upcoming key events, including a speech from Federal Reserve Chair Jerome Powell and the release of US retail sales data, both of which could further influence gold prices. The drop in gold was mainly triggered after October's US inflation data met expectations, which led to a spike in US Treasury yields and pushed the dollar to its highest level this year, putting downward pressure on gold. Investors are also considering the potential for President Trump’s policies, such as low taxes and new tariffs, to increase inflation. This could limit the Fed's ability to continue with rate cuts. Additionally, the US Department of Labor's report indicated that progress in reducing inflation has slowed since mid-year, possibly resulting in fewer rate cuts from the Fed next year.
Technical Analysis:
Gold’s break below the October 10 low of $2,603 per ounce shifted its outlook from neutral to bearish. This move has opened the door for a potential test of the 100-day Simple Moving Average (SMA) at $2,540 per ounce. If the decline continues, the next key support level is at $2,500 per ounce. Conversely, a recovery to $2,600 per ounce would bring buyers’ attention back to the 50-day SMA at $2,647 per ounce, followed by resistance at $2,650. If these levels are surpassed, the next significant resistance would be the November 7 high at $2,710 per ounce. With the Relative Strength Index (RSI) moving away from its neutral zone, bearish momentum is increasing, indicating the potential for continued weakness in gold prices.
USDJPY
Prediction: Increase
Fundamental Analysis:
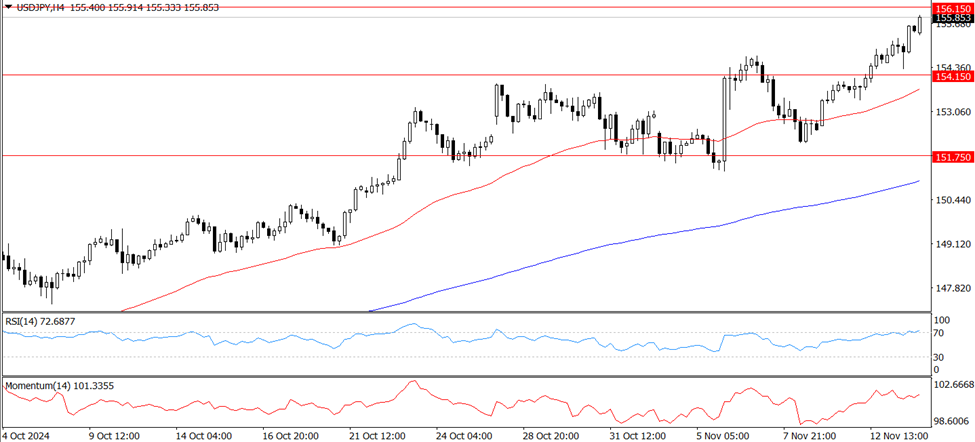
The USD/JPY pair retreated after reaching a three-month peak on Wednesday, influenced by Japan's producer price data, which revealed a greater-than-anticipated rise for October. Elevated producer inflation may drive higher consumer prices, potentially compelling the Bank of Japan (BoJ) to raise interest rates, thereby boosting the Japanese Yen. Meanwhile, the US Dollar (USD) maintains strength following October’s Consumer Price Index (CPI) release, which showed inflation ticking up as expected. This persistent inflation may deter the Federal Reserve (Fed) from reducing interest rates, thereby supporting the USD and limiting potential losses for the USD/JPY pair.
Technical Analysis:
On the H4 USD/JPY chart, the pair is currently within a third wave of upward momentum, targeting the 156.15 level. A subsequent correction toward 154.15 is anticipated after reaching this milestone, followed by a potential new wave of growth aiming for 157.00. This projection is reinforced by the MACD indicator, whose signal line remains above zero and trends upward. On the H1 chart, the market has established a consolidation zone around 154.15 and is climbing toward 156.15 within an uptrend. A correction back toward 154.15 is expected after reaching 156.15, with an intermediate target at 155.20. This outlook is supported by the Stochastic oscillator, which shows its signal line above 50 and trending upward.
EURUSD
Prediction: Decrease
Fundamental Analysis:
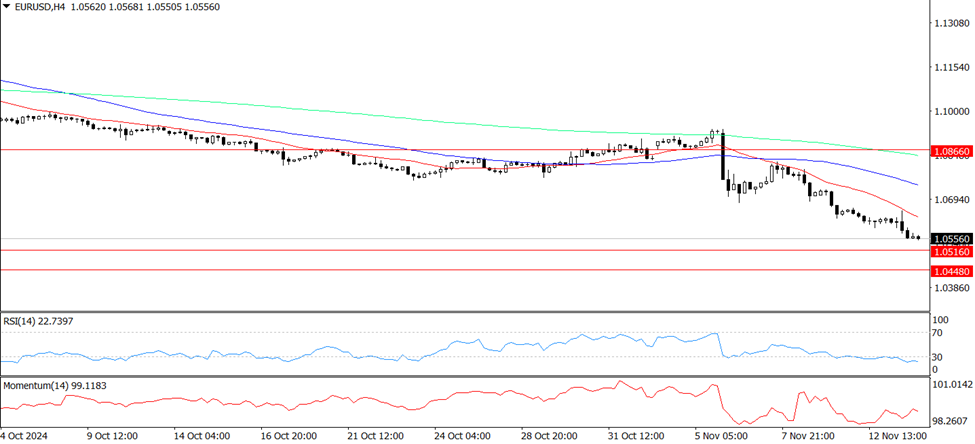
On Wednesday, the EUR/USD pair continued to face downward pressure for the fourth consecutive day, hitting fresh 2024 lows around 1.0550 due to the ongoing strength of the US Dollar (USD). The Dollar Index (DXY) edged closer to its yearly peak near 106.50, driven by investor enthusiasm surrounding potential economic policy shifts under the upcoming Trump administration, often referred to as the "Trump trade." The Euro's weakness mirrored a rise in US bond yields, while German 10-year bund yields also climbed past the 2.40% mark. Last week, the Federal Reserve cut interest rates by 25 basis points, bringing them to a range of 4.75%-5.00%. The Fed highlighted that inflation is nearing the 2% target, while the labor market shows signs of slight softening.
Technical Analysis:
The EUR/USD pair may experience further declines, targeting its 2024 low of 1.0555 set on November 13, followed by the November 2023 low at 1.0516 from November 1, and potentially reaching the 2023 low of 1.0448 recorded on October 3. Resistance is initially found at the 200-day Simple Moving Average (SMA) at 1.0866, followed by the November high of 1.0936 from November 6, and then the 55-day SMA at 1.0957. The pair remains vulnerable to further losses as long as it stays beneath the 200-day SMA. On the four-hour chart, a more pronounced downtrend is evident, with initial support levels at 1.0555 and 1.0516. Immediate resistance is located at 1.0726, followed by 1.0824. The Relative Strength Index (RSI) has fallen to approximately 25, signaling bearish momentum.
BTCUSD
Prediction: Increase
Fundamental Analysis:
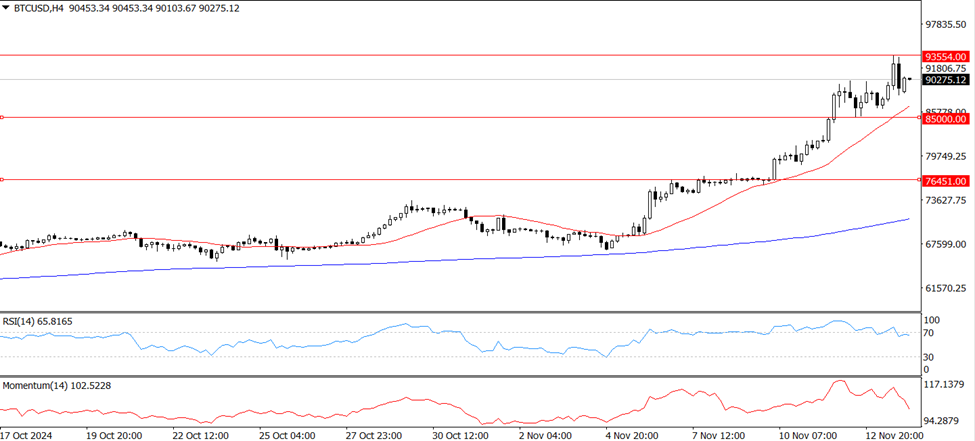
CNN and NBC have reported that Donald Trump has secured three consecutive victories, and the Republican Party now holds a narrow majority in the US House of Representatives. The October US Consumer Price Index (CPI) results met market expectations, increasing the likelihood of a Federal Reserve interest rate cut in December, which has spurred increased buying activity in the cryptocurrency market. This "Trump trade" has propelled Bitcoin to new highs, reaching a peak of $93,265 before a slight retreat. Market participants are now debating whether Trump's support for digital assets will drive Bitcoin to the $100,000 milestone or if profit-taking will emerge after Bitcoin's 33% surge following the November 5 election. Trump has indicated plans for a favorable regulatory environment for cryptocurrencies, aiming to build a strategic Bitcoin reserve and elevate the US as a global leader in the industry. Initially skeptical about digital assets, Trump's shift in stance was influenced by significant investments from crypto firms during his campaign to secure their interests.
Technical Analysis:
Bitcoin has broken past the $93,000 mark, indicating robust market demand and momentum for further gains. Data from Farside Investors shows that US Bitcoin spot ETFs attracted $4.22 billion in inflows between November 6 and November 12. However, some analysts are approaching the near-term outlook with caution, suggesting that Bitcoin may require a brief consolidation or pullback to sustain its rally. The Relative Strength Index (RSI) is currently in overbought territory, which heightens the potential for a minor retracement or stabilization. Key support lies at $85,000; a break below this level could lead to profit-taking by short-term investors, potentially pushing Bitcoin down to its 20-day Exponential Moving Average (EMA) of $76,451. Resistance is seen at $93,554, and a breach of this threshold could propel Bitcoin toward the psychological barrier of $100,000. Surpassing this milestone may set the next target at $113,331.
Disclaimer
Derivative investments involve significant risks and may result in the loss of the capital you invest. You are advised to carefully read and study the legality of the company, products, and trading rules before deciding to invest your money. Be responsible and accountable in your trading.
RISK WARNING IN TRADING
Transactions via margin involve products that use leverage mechanisms, carry high risks, and are certainly not suitable for all investors. THERE IS NO GUARANTEE OF PROFIT on your investment, so be wary of those who guarantee profits in trading. You are advised not to use funds if you are not prepared to incur losses. Before deciding to trade, ensure that you understand the risks involved and also consider your experience.
